

From the animal to the territory, a critical look on nitrogen use efficiency of dairy cattle systems (Full text available in English)
Header
Nitrogen-use efficiency and the nitrogen balance are common indicators used to assess production systems and their environmental impacts. Many mechanisms exist to improve them. However, does the overall improvement at the system level result from improvements in each of its components? Does an increase in efficiency always lead to a decrease in losses?
Introduction
Nitrogen (N) is an element essential for life on Earth and one of the main factors that limits agricultural production. The main sources of N in agricultural systems (i.e. symbiotic fixation by legumes, organic N inputs and industrial synthesis of ammonia (NH3) for mineral fertilisers) have enabled a rapid increase in agricultural production to meet the food demand of the growing world population (Erisman et al., 2008). However, N-use efficiency (NUE) (i.e. the N output obtained per unit of N used) is moderate to low, at ca. 50% globally and 36% in Europe (Sutton et al., 2011). As a result, N losses from human activities, especially agriculture, have become a global environmental threat. The volatilisation and deposition of this N in the form of NH3 or nitrous oxide (N2O, a greenhouse gas) resulting from nitrification-denitrification processes and nitrate leaching has several impacts: eutrophication, acidification of environments, loss of biodiversity at the local scale, public health at the regional scale and climate change at the global scale (Steffen et al., 2015; Campbell et al., 2017). In this context, the "N challenge" requires drastically reducing N losses while continuing to increase global food production. Among the options identified, improving the efficiency of N use in agriculture has the most potential (Bodirsky et al., 2014).
Livestock production consume large amounts of N, mainly in forage, grain and oilcakes. Ruminants can convert N from forage that cannot be consumed by humans into high-quality protein-rich animal products, making these products an essential link in the nutrient cycle. However, this conversion is not complete and results in N losses at multiple levels, from the animal to the agricultural region. NUE and the N balance are the two main types of indicators used in research or for advice to characterise N use. NUE is the ability of the system (e.g. animal, farm) to convert N inputs into outputs. It reflects the percentage of N inputs that is converted into products. The N balance, which is the amount of unused N, increases as N inputs increase, due to a NUE less than 100%. One challenge of estimating the NUE and N balance of livestock systems is the wide variety of indicators available (Table 1). These indicators differ in their objectives and in the level considered (e.g. animal, herd, farm, region). Calculation of the indicators can also differ among studies and depend upon the data available; for example, some studies do not consider atmospheric deposition, while others consider changes in soil N (Godinot et al., 2014).
Table 1. Indicators of nitrogen-use efficiency (NUE) and the nitrogen (N) balance commonly used for dairy systems, as well as their calculation methods and mean value ranges in France according to the literature.
Scale |
Name |
Acronym(a) |
Calculation(b) |
Range |
Source |
|---|---|---|---|---|---|
Nitrogen-use efficiency |
|||||
Animal |
PDI efficiency 2007(c) |
EffPDI 07 |
MPY(d)/(PDI intake - PDI requirements) |
60-70% |
|
PDI efficiency 2018 |
EffPDI 18 |
Protein expenditures(e)/ |
50-80% |
||
Feed N-use efficiency |
FNUE |
N animal products(g)/N intake |
0-35%(h) |
||
Milk N efficiency |
MNE |
N milk/N intake |
20-35% |
||
Field, |
Soil N efficiency |
SNUE |
Plant N outputs /N supplied to the soil |
30-90% |
|
Nitrogen-use efficiency |
NUE |
N animal and plant outputs /N inputs |
15-40% |
||
Nitrogen balance |
|||||
Animal |
Nitrogen excreted |
N excreted |
N intake - N animal products(g) |
330-600 g |
|
Field, farm, region |
Soil Nitrogen balance |
Soil N balance |
(N supplied to the soil – plant N outputs)/UAA(i) |
-35 to 65 |
|
Nitrogen balance |
N balance |
(N inputs(j) - N outputs)/UAA |
10-500 |
Simon and Le Corre, 1992; |
|
(a) Commonly found in the literature
(b) Variables expressed in units of mass per unit time (e.g. g N/d, kg N/d, t N/year)
(c) Calculated from protein fractions in g/d; PDI = Truly digestible (dietary + microbial) protein (INRA, 2007)
(d) Milk protein yield
(e) Includes all protein produced and exported by the animal (i.e. milk protein, non-productive protein such as endogenous faecal protein, protein exported in the scurf and protein accumulated during growth or late gestation) (INRA, 2018)
(f) PDI requirement associated with endogenous urinary protein (INRA, 2018)
(g) N from milk and meat
(h) All cattle systems
(i) N inputs include mineral fertilisers, manure (spread or deposited during grazing) and imports of organic waste. Outputs include the N exported in plants by harvest or grazing. UAA: Utilised agricultural area
(j) The N balance may or may not include symbiotic N fixation by legumes and/or atmospheric deposition. In this article, these sources are included in the N inputs.
Many studies at the animal or farm level aim to identify practices that improve the NUE of livestock production. While these practices are often associated with a decrease in the N balance, and thus N losses to the environment, their impacts at larger scales are rarely addressed.
The first section of this synthesis illustrates the main mechanisms that improve NUE and can reduce N losses at different scales (e.g. animal, farm, region). The second section discusses consequences of upscaling to assess whether the overall increase in system efficiency equals the sum of its parts (i.e. the increase in efficiency of each component of the system). The third section analyses whether an increase in efficiency is always associated with a decrease in N losses. Finally, the fourth section explores the relevance and limitations of these indicators for dairy cattle systems.
1. Main mechanisms for improving nitrogen-use efficiency at different levels
Regardless of the level of organisation, the N not used to produce plants or animals will be emitted into the environment and can contribute to air and water pollution (e.g. NH3 volatilisation, N2O emissions from soils, nitrate leaching). This loss of N is also expensive for farmers and a source of economic inefficiency, which justifies identifying mechanisms that optimise N use at each level of the system.
1.1. Animal level
At the animal level, NUE and protein-use efficiency are indicators calculated to assess N use. NUE is defined as the ratio of the amount of N exported (in milk and/or meat) to the amount of N ingested (e.g. feed NUE (FNUE) or milk NUE (MNE); Table 1). Protein-use efficiency is defined as the ratio of the amount of protein exported by an animal (in milk, meat and/or non-productive protein fractions) to the total amount of protein that is absorbed during digestion (EffPDI; PDI is truly digestible (dietary + microbial) protein, the equivalent in INRA (2018) system to Metabolisable Protein; Table 1). Nitrogen-use inefficiency (1 – FNUE or 1 – MNE) results in N excretion in urine and faeces, while protein-use inefficiency (1 – EffPDI) results in N excretion in urine due to catabolism of protein amino acids (AA).
Faecal N excretion (150-200 g N/cow/d for a cow ingesting ca. 600 g N/d) is caused by non-digestible dietary N, undigested microbial N and an endogenous fraction of N. It depends mainly on the total amount of dry matter ingested (8.42 ± 2.02 g faecal N/kg dry matter ingested; INRA, 2018) and little on the N content of the diet. Faecal N is excreted mainly in organic forms, which are unlikely to volatilise into NH3 (Peyraud et al., 1995). Urinary N excretion varies greatly and depends greatly on the crude protein (CP) content of the diet (e.g. decreasing by 66% when the CP content of the diet decreased from 20% to 15%; Castillo et al., 2000). Urinary N comes mainly from urea (50-90%; Bussink and Oenema, 1998), which is the main source of NH3 volatilisation in ruminant manure.
Many studies have shown that each 10 g/kg decrease in CP in the diet results in a net increase of 1.2-1.4 percentage points in MNE (Huhtanen and Hristov, 2009). The type of N supplied in the diet can also be modified, beginning with the proportion of rumen-degradable protein. The aim is to improve the balance between soluble N and fermentable organic matter, because having more degradable protein than fermentable energy in the rumen significantly increases excretion of urea in the urine (Vérité and Delaby, 2000). In the INRA (2018) feeding system, this balance is estimated as the rumen protein balance (RPB) (i.e. CP intake minus non-NH3 CP entering in the duodenum). Thus, diets with a negative RPB (12% CP, RPB = ca. -10 g/kg DM) have a NUE that is 10 percentage points better (MNE = 31%) than those of diets with a positive RPB (18% CP, RPB = 24 g/kg DM, MNE = 20%; Edouard et al., 2016, 2019). Diets that are deficient in rumen-degradable protein promote the reuse of urea for microbial synthesis.
The second source of urinary N production is the catabolism of protein AAs into urea. PDIs are hydrolysed into AAs during intestinal digestion, and each tissue or organ takes these AAs up to synthesise proteins. Even in diets with a limiting proportion of degradable protein, hepatic catabolism of AAs and its contribution to urinary N is not negligible (Raggio et al., 2004). The INRA (2018) ruminant feeding system calculates PDI-use inefficiency (1 – EffPDI 18, Table 1) to estimate AA catabolism. Thus, a 24% decrease in N intake in the diet, which is a large decrease in the diet's PDI content (from 104 to 79 g/kg DM), increases MNE by 4 percentage points and EffPDI 18 by 16 percentage points (Figure 1). These increases are due mainly to a decrease in the catabolism of AAs into urea (52%) and by an increase in urea recycled in the rumen. This decreases excretion of urinary N greatly (57%) and that of faecal N to a lesser extent (-10%).
Figure 1. Nitrogen (N) flows (in milk, faeces and urine) and use efficiencies for dairy cows fed a high-protein (HP) or low-protein (LP) diet (data from Raggio et al. (2004)).
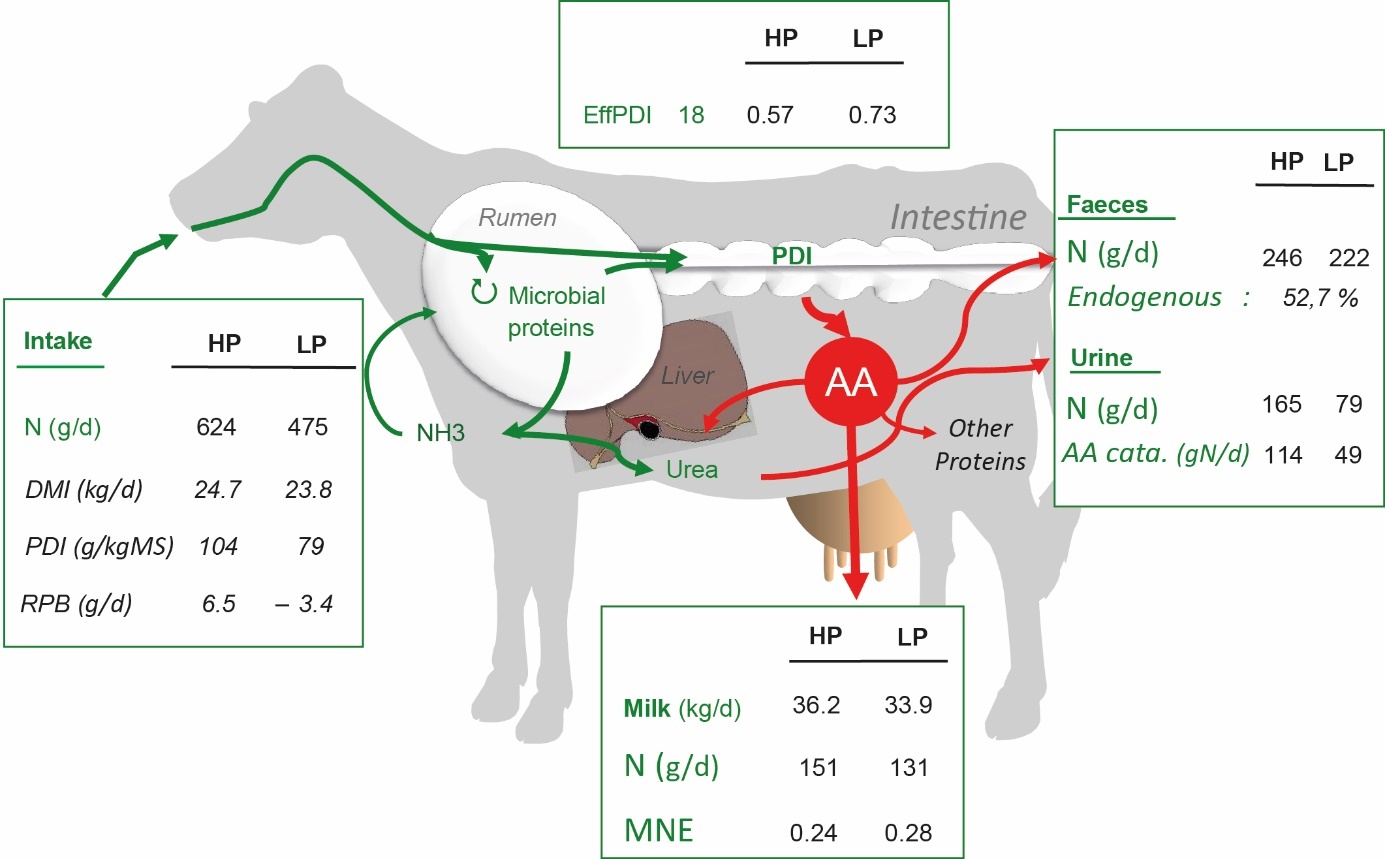
Reducing PDI supplies thus increases their efficiencies (EffPDI 07 and EffPDI 18) of utilization. Reducing PDI supplies decreases the supplies of all AAs (essential and non-essential) leading to a decrease in the catabolism of many AAs that are supplied in excess (Haque et al., 2015). However, it can also decrease milk and milk-protein yields (-6% and 12.5%, respectively; Figure 1). Nevertheless, the decrease in milk-protein yield is smaller than that in PDI intake. Better balancing the AA profile (i.e. LysDI, MetDI and HisDI for Lys, Met and His Digestible in the Intestine) can partly limit the decrease in milk-protein yield and thus increase PDI-use efficiency (Broderick et al., 2009; Haque et al., 2012, 2015; Lemosquet et al., 2014). Better balancing LysDI and MetDI supplies in mid-lactation cows increases by 2-3 and 2-5 percentage points the N-use and PDI-use efficiencies, respectively (Haque et al., 2012, 2015; INRA, 2018). These efficiency gains are lower, however, than the increase obtained (10 percentage points) when decreasing PDI intake from 100 to 90 g/kg DM (Lemosquet et al., 2014; INRA, 2018). Dietary factors other than N intake, such as increasing energy supplies and providing a high-starch diet, can also increase protein-use efficiency by increasing milk-protein yield (Rigout et al., 2003; Brun-Lafleur et al., 2010; Cantalapiedra-Hijar et al., 2015).
1.2. Farm level
At the farm scale, NUE is the indicator used most often (Powell et al., 2010; Leip et al., 2011; Quemada et al., 2020) (Table 1). It is calculated as the ratio of the N in agricultural products leaving the farm (e.g. milk, meat, crops) to the N in inputs (e.g. feed and seeds, organic and mineral fertilisers, symbiotic fixation by legumes, purchase of replacement animals, atmospheric deposition). This indicator usually accompanies the N balance, which is calculated as the difference between the same variables (inputs – outputs), and represents the "pollution potential" of the farm (Simon and Le Corre, 1992; Table 1). The N balance is commonly used to assess the overall N management of farms and the pressure they exert on the environment.
Figure 2. Nitrogen (N) flows (kg N/ha utilised agricultural area (UAA)/year on a dairy farm in Brittany, France, with 80 ha of UAA, including 25 ha of cereals, and 82 livestock units (adapted from Peyraud et al. (2012a)).
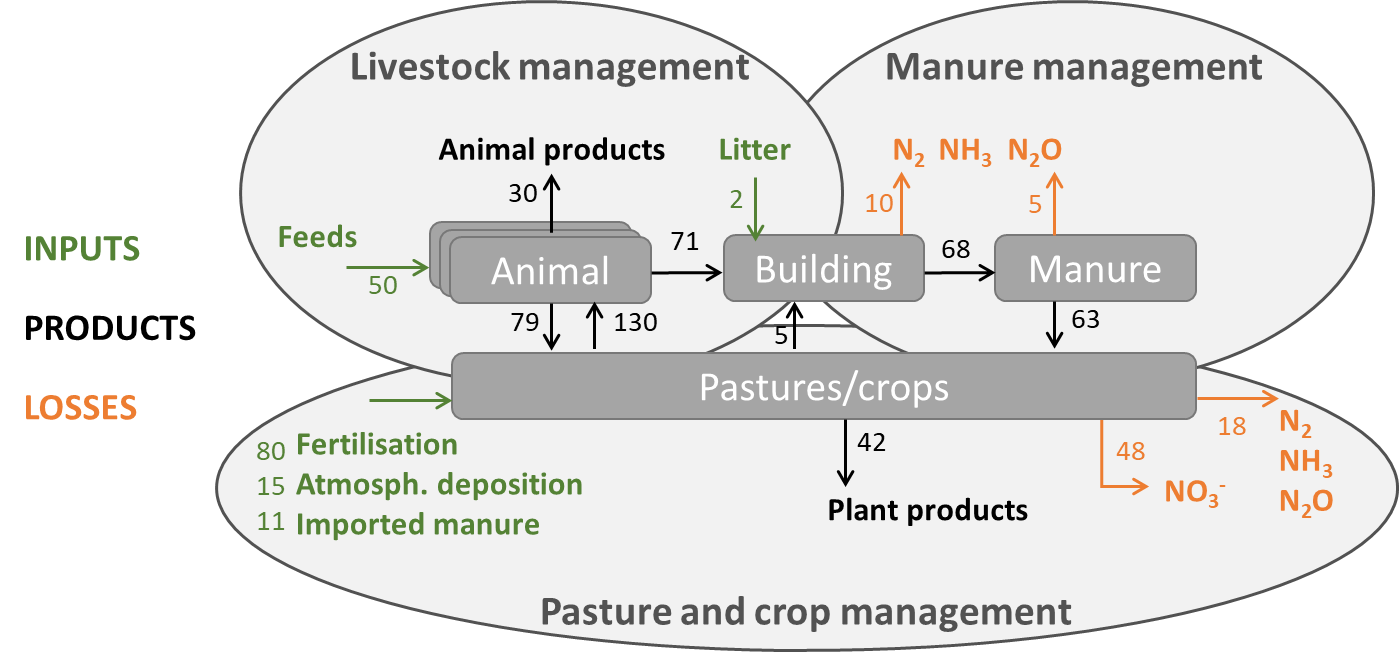
The mechanisms implemented to improve NUE include herd management (e.g. breed, feed, reproduction and renewal), manure management, plant management and N recycling on the farm (Figure 2).
a. Herd and manure management
Increases in efficiency related to animal genetics or breed are difficult to quantify because these mechanisms are usually associated with a given breeding system. A simulation study, based on results of the "Which cow for which system?" experiment conducted at the INRAE experimental farm of Le Pin-au-Haras, was conducted to assess the influence of animal-, feed- and herd-management factors (Box 1). Its results highlight the utility of an overall and integrated approach for assessing the factors involved in the management, efficiency and fate of N and, more generally, the environmental performance of dairy systems.
DMI: dry matter intake, DM: dry matter, MNE: milk N-use efficiency
The "Which cow for which system?" experiment, conducted for 14 years at the INRAE experimental farm of Le Pin-au-Haras (France, DOI: 10.15454/1.5483257052131956E12), was used to estimate the influence of i) the breed (Holstein or Normande), ii) the genetic type (higher potential for milk production at the expense of lower milk fat and protein concentrations, or vice-versa), iii) the age at first calving (2 or 3 years), iv) the feeding strategy (high or low, corresponding to the presence or absence, respectively, of concentrates and maize silage in the diet), v) the strategy for selling heifers in excess of renewal (at 15 days of age or when they are still pregnant) and vi) the renewal rate of the herd (20%, 25%, 30%, 35% or 40%) on nitrogen (N) flows and losses (Foray et al., 2020).
By combining the 160 treatments tested (2 × 2 × 2 × 2 × 2 × 5), the data collected in the experiment were used to simulate 160 dairy systems that had the target of producing 400 000 L of fat-and-protein-corrected milk per year. The herd demographics of each system simulated were defined from the experimental data to meet the production target. The area dedicated to each herd was determined from the amount of forage required per feeding period, and thus differed among systems. Multi-criteria environmental analysis of each system was performed using the CAP'2ER tool (https://cap2er.eu/) to estimate, among other things, N-use efficiency (NUE) and the N balance.
For all simulations, at the scale of the dairy system, the NUE was 24 ± 5%, and the N balance was 146 ± 10 kg N/ha utilised agricultural area (UAA). The most efficient system (NUE = 33.6%) was the Holstein system with a milk fat and protein concentrations-oriented strategy, an age at first calving of 2 years, a high level of feeding, heifers sold at 15 days and a renewal rate of 20%. Its N balance was, however, above the mean, at 149 kg N/ha. The low feeding level had a significantly lower NUE than the high feeding level did (18.5% vs 28.8%, respectively); however, despite having a significantly larger N balance (149 vs 143 kg N/ha UAA), it had less potential for N leaching (46 vs 69 kg N/ha UAA, respectively) due to more N immobilisation (57 vs 22 kg N/ha UAA, respectively) caused by a larger grassland area. Similarly, for a given breed and feeding strategy, a decrease in the renewal rate improved NUE but increased the N balance (see graph), as this system required less area (especially grassland) to rear heifers.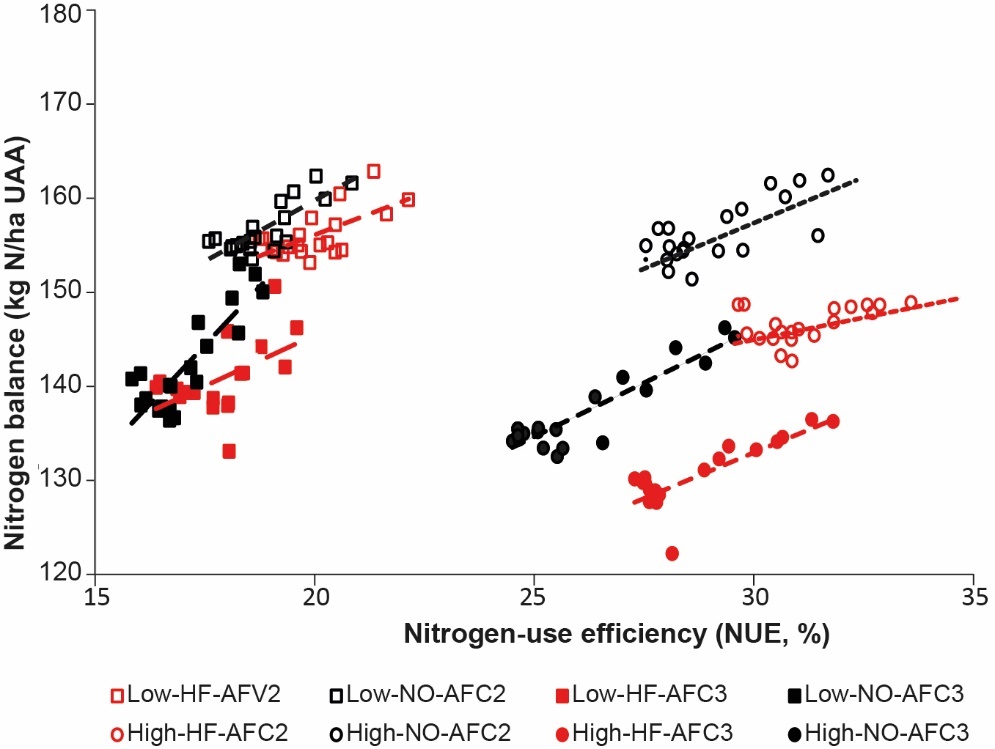
Nitrogen (N) balance (kg N/ha UAA of the dairy system) as a function of N-use efficiency (NUE, %) of 160 simulated systems by feeding strategy (High vs Low), breed (Holstein (HF) vs Normande (NO)) and age at first calving (2 years (AFC2) vs 3 years (AFC3)).
This study, which also calculated other environmental indicators (especially greenhouse gas (GHG) emissions; Foray et al., 2020), highlights the challenges in establishing a reference system that would identify the most relevant efficiency and environmental indicators, especially due to certain antagonisms. For example, the system with the lowest GHG emissions per L of milk (1.03 kg CO2-eq./L) had one of the highest N balances (160 kg N/ha), whereas the system with the lowest N balance (122 kg N/ha) would have emitted more GHGs for the same amount of milk produced (1.15 kg CO2-eq./L milk).
Combining complementary forages to a herd's diet improves NUE due to their differing N and energy balances. For example, a diet with 80% maize silage and 20% lucerne increased the MNE by 6.5 percentage points and reduced urinary N excretion by nearly 20% compared to a diet with the opposite percentages (20% and 80%, respectively; Arndt et al., 2015) due to the 1.5 percentage-point decrease in the N content of the diet. At the farm level, however, it is important to consider not only the feed-use efficiency of the animals, but also the N flows within the farming system. While dairy systems based on a large percentage of conserved forage in the herd's diet (maize silage > 30% of the forage area (FA)) generally have better feed-use efficiency than grass-based systems do, NH3 emissions at the farm level are often higher (e.g. a 4 percentage-point increase in efficiency, but a 30% increase in N-NH3 emissions per t milk in western France; Faverdin and van Milgen, 2019). This increase is associated with the animals spending more time in the building and more manure stored, which increases gas emissions, and with intensification of milk production per ha due to large amounts of purchased supplemental protein. This intensification leads to higher N inputs per ha and thus an increase in N losses.
At pasture, N concentrate supplies have little influence on milk production based on well-fertilised grasslands in the spring (60 kg N/ha), suggesting that a sufficient amount of grass can provide the energy and protein required to produce 25-27 kg milk/cow/d (Delaby et al., 1996). Moderately fertilising grasslands rather than supplementing protein for the animals can increase grassland productivity and thus increase the number of grazing days per ha (312 grazing days/ha with grasslands fertilised at 60 kg N/ha/cycle vs 206 grazing days/ha with grasslands fertilised at 20 kg N/ha/cycle in the spring; Delaby et al., 1996). This double effect of N fertilisation in spring improves system efficiency more than supplying protein-rich concentrates.
Feeding strategies (whether including grazing or not) and diet characteristics (e.g. type of forage, N content, N/energy balance) also influence the amount and composition of animal waste (e.g. faeces/urine partitioning, urea N content) in interaction with their management. When animals graze, their urine and faeces are deposited directly and separately, usually on active plant cover, which uses N directly. Urine diffuses rapidly in the soil pore space, far beyond its immediate impact zone. Because the soil can assimilate much of this N in organic form, volatilisation is low despite the large amounts of N that the animals deposit locally. Leaching losses are a more serious risk (Peyraud et al., 2012b), although they can be limited if the instantaneous stocking rate is adapted to the amount of grass available. In buildings, N losses depend on the type and management of the manure. For diets that are excessively high in N (18% MAT; Edouard et al., 2019), N-NH3 emissions are higher when animals produce manure on deep litter (nearly 100 g N-NH3/cow/d) than when they produce slurry in open barns (68 g N-NH3/cow/d). The high gas emissions (NH3 and N2O) during the management of manure from high-N diets (i.e. buildings to storage) result in a lower fertiliser value (total N and N-NH3 content) than that of manure from lower-N diets (Edouard et al., 2015), which may degrade the overall efficiency of the system.
Practices that reduce N losses along the building-storage-spreading continuum (e.g. slurry treatment, pit covers) are effective at reducing NH3 and/or N2O emissions and are thus essential to optimise efficiency at the farm level. However, these practices can have contrasting effects depending on the gas considered (including CH4 and CO2) or the season (Kupper et al., 2020), which calls for assessing overall effects of these practices.
b. Crop management and fertilisation
At the crop level, breeding varieties with root characteristics that can access soil resources better, remobilise N better and have a higher harvest index has great potential to improve the efficiency of cropping systems (Hawkesford and Griffiths, 2019). Reducing crop fertilisation also improves NUE (Mueller et al., 2017) according to Mitscherlich (1924) law of diminishing returns. This is especially true as the calculation of NUE does not generally consider changes in soil organic matter content (Godinot et al., 2014). High mineralisation of soil organic matter, if not compensated for in the same year by applying an equivalent amount of organic matter, thus improves the efficiency of the system by emitting nitrogen, which can result in an efficiency greater than 100% in low-input cropping systems. This is a paradoxical situation in the long term as the efficiency improves at the expense of soil fertility (Quemada et al., 2020). However, in some western European countries (e.g. France, Greece, the Netherlands), decreasing fertiliser inputs in the past few decades has not decreased crop yields, but instead has decreased N losses by 50 to 200 kgN/ha (Lassaletta et al., 2014). This increase in efficiency is due to a decrease in waste associated with over-fertilisation (Mueller et al., 2014).
Implementing all good fertilisation practices simultaneously (“right rate, right time, right place”) can improve fertiliser-use efficiency (Li et al., 2019). Fertilisers with better efficiency (e.g. with polymer coating or nitrification or urease inhibitors) can also improve crop NUE, but only when other good practices are also implemented (Li et al., 2018). While mineral fertilisers generally have better NUE than organic fertilisers at the field and cropping-year scale (the ammonium-nitrate-equivalent coefficient of organic fertilisers ranges from 0.1-0.7 depending on the type of fertiliser and when it is applied), the results differ at the scale of a mixed crop-livestock farm and over the longer term. Livestock manure is a nutrient-rich co-product that can be used on the farm, exported to a neighbouring farm or, if too much is produced, treated to reduce its N content. Good agronomic use of waste can have a positive effect at the farm scale by decreasing the losses related to storing and spreading it, but also by decreasing the use of mineral fertilisers and the losses related to their manufacture and use. In addition to its value as fertiliser that supplies N, phosphorus and potassium, it is important to consider the influence of livestock manure on the organic matter content and physical, chemical and biological fertility of soil. Long-term experiments have shown that inputs of livestock manure can, in certain situations, have better NUE than equivalent inputs of mineral fertiliser due to improved soil quality (Duan et al., 2014).
Animal and plant production are usually closely connected at the system level. On French dairy farms, more than 80% of the dry matter consumed by the animals is produced on the farm (Rouillé et al., 2014), and more than 60% of the N fertilisation comes directly from livestock manure (Foray et al., 2017). Due to this integration, farm efficiency is related to the feed-use efficiency of the herd, the agronomic efficiency of fertilisers and decreasing N losses during transfer between subsystems and storage. These interactions can improve farm efficiency by up to 40% (Godinot et al., 2015). Farms with the best NUE usually have moderate fertiliser and feed inputs and a stocking rate adapted to the agronomic potential of the environment (as a function of the climate), while maintaining high milk production (Powell et al., 2010; Thomas et al., 2020). A good match between the animal and crop subsystems can reduce feed and fertiliser purchases by optimising the use of the crops and manure produced. Therefore, mixed crop-livestock systems provide interesting mechanisms for improving NUE (Schröder et al., 2003; Wilkins, 2008; Thomas et al., 2020).
1.3. Regional level
Calculations of NUE at the scale of an agricultural region usually simplify the region into a single farm by default due to a lack of data on the flows between farms. We also adopted this approach because it is not relevant to consider only milk production at the regional scale. NUE is the main efficiency indicator used at this scale (Table 1) and describes the overall efficiency of transforming inputs into agricultural products at the regional scale (Leip et al., 2011; Godinot et al., 2016). It is also used to assess the influence of public policies, such as the European Union (EU) Nitrates Directive, on N management (Dalgaard et al., 2014; Lassaletta et al., 2014).
Identifying synergies between crops and livestock at the regional scale adds mechanisms to those at the farm scale, in particular the complementarity between crop farms and livestock farms due to the exchange of forage, grain, straw and manure. This regional organisation usually addresses the agronomic problems associated with farm specialisation (Ryschawy et al., 2017). Introducing crops or legumes, alone or together, along with catch crops in rotations can improve the NUE of a farm by reducing the purchase of N fertilisers and improving their use by reducing N losses (Martin et al., 2016; Moraine et al., 2016). These types of production are thus ultimately used on nearby farms. Exporting manure from livestock farms avoids potential surpluses and over-fertilisation, and reduces the purchase of fertilisers by the receiving crop farms. Similarly, improving the protein self-sufficiency of livestock farms in a region by producing protein-rich crops (especially oilseed and protein crops) can improve the overall NUE by reducing imports of concentrates and the use of mineral fertilisers (Russelle et al., 2007). However, these complementarities between crops and livestock can sometimes degrade the NUE of the region. While exporting manure to third parties promotes the intensification of livestock production, if its application is not accompanied by an equivalent decrease in mineral fertiliser application (Regan et al., 2017), then the potential benefit instead degrades the N balance of the region.
Considering the regional scale also enables considering the context in which a farm is located. Efficient N management depends on practices at the farm level, as well as practices on neighbouring farms. Thus, livestock manure is generally used more efficiently when it is spread near to where it is produced. It is not always possible to do so in areas with dense livestock production (Zebarth et al., 1999), which thus requires costly exports. Certain regulations, such as the Nitrates Directive, have resulted in more effective use of livestock manure and a decrease in mineral fertiliser application, which has greatly improved the NUE of the areas concerned (Dalgaard et al., 2014; Buckley et al., 2016). Optimising the distribution of N inputs as a function of the region's production potential would also decrease over-fertilisation and reallocate these resources to less-fertilised areas. This would increase production for a given amount of N use and improve the overall NUE (Ewing and Runck, 2015). This approach can be applied from the scale of a few farms to the global scale (Mueller et al., 2017).
One important mechanism is to use the resources associated with the multiple types of agricultural production in a region, as opposed to the specialisation observed in certain French regions . For example, crop production is generally more efficient than livestock production, poultry production is more efficient than cattle production, and legume production is more efficient than fruit and vegetable production (Godinot et al., 2015). Efficiency can increase greatly due to the complementarity between crop and livestock production (e.g. consumption of forage legumes or co-products by ruminants, use of livestock manure as fertiliser). A concerted change in production at the regional scale that promotes more diversified and complementary production could thus improve the NUE at the regional scale.
2. Is a system’s overall efficiency equal to the sum of the efficiencies of its components?
2.1 Integration at the farm level
Assessment (conceptual modelling based on the "hole in the pipe" principle; Oenema et al., 2009) of the most effective practices identified three strategies that reduce N losses and improve the efficiency of European agriculture: (i) balancing crop fertilisation with good manure management, (ii) reducing the protein content of animal feed and (iii) adopting good manure management practices at building, storage (pit cover) and spreading (direct burial) stages by limiting NH3 emissions. Combining these practices could improve the European NUE by ca. 25% (Oenema et al., 2009).
However, Faverdin and Van Milgen (2019) present several examples of ruminant and monogastric farming that illustrate how expected benefits can sometimes be lost when changing scale. They indicate that the aggregated approach, based on the assumption that improving each component of a system will improve the overall performance, is not always correct. Conversely, optimising the overall functioning of livestock systems likely provides the most benefits for performance, economics and environmental impacts.
Analysis of experiments at Trévarez, Derval, La Blanche Maison (Chambers of Agriculture of Brittany, Pays de la Loire and Normandy, respectively) and Marcenat (Auvergne, INRAE Herbipôle, https://doi.org/10.15454/1.5572318050509348E12) was used to estimate N flows at the animal and farm scales and identify effects of changing scales depending on the production system (Foray et al., 2017). The experimental farms included systems with a diet based on maize silage and grass (grazed and harvested), from extensive grassland systems at Marcenat and La Blanche Maison 2 (milk production < 5 200 L/ha FA and < 5 300 L/cow) to more productive systems at Derval and Trévarez 1 (> 8 000 L/ha FA and L/cow), in which maize covered a larger percentage of the FA (39% and 50%, respectively; Table 2).
Box 1. Simulations of nitrogen-use efficiency and the nitrogen balance for a variety of dairy systems based on data from the”Which cow for which system?” experiment (Foray et al., 2020).
Experimental farm |
Trévarez |
Trévarez |
Derval |
La |
La |
Marcenat |
Marcenat |
|
|---|---|---|---|---|---|---|---|---|
Forage system |
Maize |
Maize/grass |
Maize |
Maize |
Grass |
Grass |
Grass |
|
Years monitored |
2013-2014 |
2013-2014 |
2011-2014 |
2011-2014 |
2011-2014 |
2011-2012 |
2011-2012 |
|
Maize in FA1 |
50% |
26% |
39% |
32% |
0% |
0% |
0% |
|
Number of cows |
55 |
63 |
89 |
35 |
35 |
22 |
22 |
|
Milk produced/cow (L) |
8 118 |
7 311 |
8 544 |
6 121 |
5 285 |
5 023 |
5 260 |
|
Milk produced/ha FA (L) |
9 112 |
7 613 |
8 068 |
7 142 |
5 139 |
1 796 |
3 969 |
|
Livestock units/ha FA |
1.64 |
1.51 |
1.30 |
1.80 |
1.40 |
0.63 |
1.05 |
|
Nitrogen balance and nitrogen-use efficiency at the dairy cow level (kg N/cow/year) |
||||||||
Forage N intake |
102 |
139 |
88 |
83 |
115 |
109 |
91 |
|
N in ingested concentrates |
46 |
29 |
86 |
70 |
23 |
0 |
15 |
|
Total N intake |
148 |
168 |
174 |
153 |
138 |
109 |
106 |
|
Milk protein N content (g/kg) |
31.2 |
30.3 |
32.8 |
34.9 |
34.2 |
30.4 |
31.5 |
|
N in milk and meat |
42 |
38 |
49 |
45 |
39 |
28 |
31 |
|
Animal N balance |
106 |
130 |
125 |
108 |
99 |
81 |
75 |
|
Feed NUE |
28% |
23% |
28% |
29% |
28% |
26% |
29% |
|
Nitrogen balance and nitrogen-use efficiency at the system level (kg N/ha utilised agricultural area) |
||||||||
Total N inputs |
238 |
190 |
152 |
174 |
127 |
25 |
105 |
|
of which N in forage |
93 |
44 |
80 |
99 |
46 |
2 |
21 |
|
of which N from symbiotic fixation |
32 |
36 |
31 |
40 |
44 |
12 |
27 |
|
of which N in mineral fertilisers |
42 |
38 |
31 |
0 |
0 |
0 |
47 |
|
Total N output |
121 |
95 |
54 |
66 |
56 |
12 |
24 |
|
System N balance |
117 |
95 |
98 |
108 |
71 |
13 |
81 |
|
Potential N leaching |
44 |
27 |
34 |
18 |
10 |
0 |
0 |
|
Nitrogen-use efficiency |
51% |
50% |
36% |
38% |
44% |
48% |
23% |
|
1 FA: forage area
NUE at the animal level varied less among the seven farming systems (23-29%) than NUE at the farm level (23-53%). Thus, “good” efficiency at the animal level did not necessarily translate into better efficiency at the system level, as indicated by comparisons between Trévarez 1 and 2, La Blanche Maison 1 and 2, and Marcenat 1 and 2. These variable efficiencies were not synonymous with a low system N balance or lower N losses to the environment. For example, the two systems at Trévarez had similar NUE, but the N balance of the "maize" system was 22 kg N/ha higher than that of the "maize/grass" system, resulting in higher potential N leaching (+63%). This difference in the N balance was due to the higher N inputs in the “maize” system, particularly of concentrates.
A specific analysis of lowland systems with more than 30% maize in the FA showed that the farms with the lowest N balance also had better NUE (N balance = 79 ± 10 kg N/ha, NUE = 45 ± 11%) than the least efficient systems (N balance = 152 ± 8 kg N/ha, NUE = 28 ± 6%) (Foray et al., 2018). These efficient farms purchased fewer concentrates than the least efficient systems (185 ± 70 vs 231 ± 43 g/L milk, respectively) and N in mineral fertilisers (64 ± 28 vs 110 ± 28 kg N/ha, respectively), which resulted in lower milk production per cow (8%) or per ha (-15%). These assessments reveal contrasting levels of NUE and N balances among farming systems. However, for a given type of system, careful management of herd feeding and crop fertilisation improves use of N inputs.
2.2 Integration at the regional level
A weighted mean of farm efficiencies does not necessarily predict the efficiency of the region because the flows considered to calculate efficiency are modified by this change in scale. Some exchanges between farms (e.g. straw/manure) are no longer N inputs or outputs but internal flows within the region. It is sometimes difficult to distinguish between feed produced in the region (i.e. internal flows) and feed imported into the region (i.e. inputs). At the farm or regional level, N inputs can increase when local feed resources do not meet the feed needs of the herds, reflecting an imbalance between animal density and the land available to feed them. This lack of feed self-sufficiency requires substantial external purchases, whose surpluses remain in the region. The resulting N balance can thus exceed the region’s recycling and recovery capacities and increase the risk of pollution.
As part of a study performed by the Institut de l'Élevage (Foray and Leroy, 2018) for CRESEB (Centre de Ressources et d'Expertise Scientifique sur l'Eau en Bretagne), environmental dimensions of scenarios for improving the efficiency of dairy systems in the Couesnon River catchment of France (Brittany) were assessed. Eleven typical dairy farms were defined at the catchment scale based on an agricultural assessment conducted in 2014. A classification based on 6 technico-economic variables was used to group all the farms into these 11 typical types to estimate the percentage of each typical type at the catchment scale. The indicators calculated at the regional scale were used to analyse the scenarios, and were based on the weighted mean of the representativeness of each type in the region. Environmental analyses of these typical types were performed using the CAP'2ER tool.
Ways to improve these typical types (reflecting the real functioning of the farms surveyed in the agricultural assessment) were identified, which resulted in an optimised scenario. The changes proposed in this optimised scenario resulted in a 13% decrease in the amount of concentrates used per cow per year for a given production level, and a 17% decrease in application of mineral N fertilisers. In the optimised scenario, the NUE of the types improved by 1-8%, and that of the overall dairy region improved by 4% (Table 3). This improvement in efficiency was due to a decrease in the dependence on inputs imported into the region (i.e. protein concentrates and mineral fertilisers). This optimised scenario also decreased the mean N balance by 15% (from 114 to 97 kg N/ha).
Table 2. Descriptions, nitrogen (N) balances and N-use efficiencies of seven dairy systems monitored on four experimental farms in France: Trévarez, Derval, La Blanche Maison and Marcenat (adapted from Foray et al. (2017)).
Characteristic |
Scenario |
|
|---|---|---|
Baseline |
Optimised |
|
Grass area in total UAA |
38% |
38% |
Maize silage area in total UAA |
30% |
30% |
Cash-crop area in total UAA |
32% |
32% |
FA in total UAA |
68% |
68% |
Stocking rate (LU/ha FA) |
1.84 |
1.83 |
Milk yield (kg/ha FA) |
9 304 |
9 295 |
Milk yield (kg/ha UAA) |
5 636 |
5 636 |
Concentrates fed (kg/cow) |
1 479 |
1 282 |
Concentrates fed (g/L milk) |
196 |
170 |
Total N inputs (kg N/ha UAA) |
191 |
175 |
of which N from concentrates (kg N/ha UAA) |
83 |
79 |
of which mineral N fertilisation (kg N/ha UAA) |
62 |
51 |
Total N output (kg N/ha UAA) |
77 |
78 |
N balance (kg N/ha UAA) |
114 |
97 |
N-use efficiency |
40% |
44% |
UAA: utilised agricultural area; FA: forage area; LU: livestock units
This theoretical analysis shows that specific measures implemented at the scale of each of dairy system would improve their efficiency and reduce losses at the local and regional scales. Optimising N management among systems could further improve this efficiency, but the actual relevance of these approaches remains difficult to verify in the field.
3. Relations between efficiency and environmental impacts
Two main strategies improve efficiency regardless of scale: increasing output for a given amount of (or small increase in) input, or reducing inputs with little or no decrease in output. These two strategies usually correspond to differences in economic reasoning, as observed in EU member states. Regardless of the strategy chosen, this synthesis shows that different mechanisms exist for improving the “system” (e.g. animal, subsystem, farm, group of farms), increasing efficiency and reducing losses. For farmers, a decrease in production is often perceived as an obstacle to implementing good practices. However, due to the high marginal cost of the last kg produced, decreasing inputs often compensates for a decrease in revenue (Pellerin et al., 2013). From an economic viewpoint, this “input-saving” strategy amounts to increasing the gross operating surplus (GOS)
The “hole in the pipe” model (Oenema et al., 2009) is useful for analysing differences in the behaviour of these NUE and N-loss indicators. According to it, N inputs, outputs and losses in agricultural systems are not independent: a change in one flow can influence those that follow it (Figure 3). Thus, applying a mechanism to improve NUE and decrease the N balance at a given level ("plugging a hole") could increase N losses at a larger level of organisation and thus degrade the NUE of the overall system.
Figure 3. Nitrogen (N) flows at the farm level according to the "hole in the pipe" model (adapted from Oenema et al. (2009)).
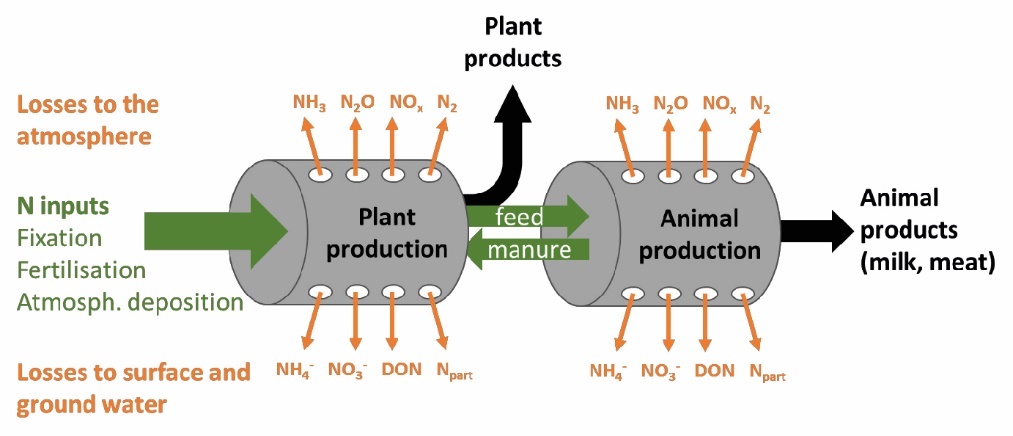
DON: dissolved organic N; Npart: particulate organic N
In Ireland in the 2010s, the NUE of dairy systems improved (from 19.7% to 24.4%) but the N balance increased (from 154 to 179 kg N/ha; (Dillon et al., 2020), which indicates more N losses to the environment. Similarly, dairy systems in the Netherlands are among the most efficient, but they also have the highest N balances. Dairy systems monitored in the EU H2020 project EuroDairy indicated that some of those that used large amounts of inputs (> 700 kg N/ha) had N balances greater than 500 kg N/ha (Foray et al., 2019). These observations agree with those of the EU Interreg project Green Dairy in the early 2000s (Raison et al., 2008). Conversely, farms in western France are less efficient but lose less N due to lower input use (Quemada et al., 2020). For example, specialised dairy farms in Brittany reduced mineral fertilisation by 50% from the mid-1990s to 2010 in response to regulations introduced by the Nitrates Directive, the establishment of vulnerable zones and associated action programmes. Improved fertilisation management and more recognition of the value of livestock manure as an organic fertiliser have been accompanied by better agronomic practices, which has improved NUE by from 27% to 39% and reduced the N balance from 143 to 93 kg N/ha. This result partly reflects a decrease in waste caused by substantial over-consumption of N inputs.
At the regional level, the efficiency and impacts of production systems are not inherently related. Their relationship depends primarily on the density of livestock production and thus on the ability of the environment to support it. A few inefficient farms in an area with low livestock density will often have a moderate impact in the region because they are “diluted” over a large area. This occurs in Portugal and some regions of Spain and Scandinavia. However, efficient farms can have more impact on terrestrial and aquatic environments, such as in the Netherlands and Belgium, where emissions to the water and air are higher because they have a high animal density, despite having better NUE than those of other European countries (Godinot et al., 2016).
The potential environmental impact of this N surplus depends on the sensitivity of the environment (e.g. climate conditions, soil types), especially its capacity to recycle and use the N from livestock farms, which can depend on the soil and climate context as well as farming practices (Peyraud et al., 2012b). In highly grazed livestock farming areas, nitrate leaching is often minimal and has little effect on water quality. This is true in the Massif Central, the Alps, Burgundy and Limousin regions, which are dominated mainly by grassland cattle farming and have some of the lowest nitrate concentrations in surface and ground water in France (Foray and Manneville, 2019).
Conversely, in certain highly intensive grassland systems per ha (but not per cow), such as in New Zealand, milk production increased by more than 5 000 L/ha from the 1990s to the early 2010s due to an increase in use of concentrates and mineral fertilisers. This intensification increased the N balance (+60 kg N/ha) and N leaching (+ ca. 8 kg N/ha) and degraded water quality (Richard et al., 2017). Regional plans for freshwater management have been implemented to limit these risks of losses and to stop the degradation of water quality.
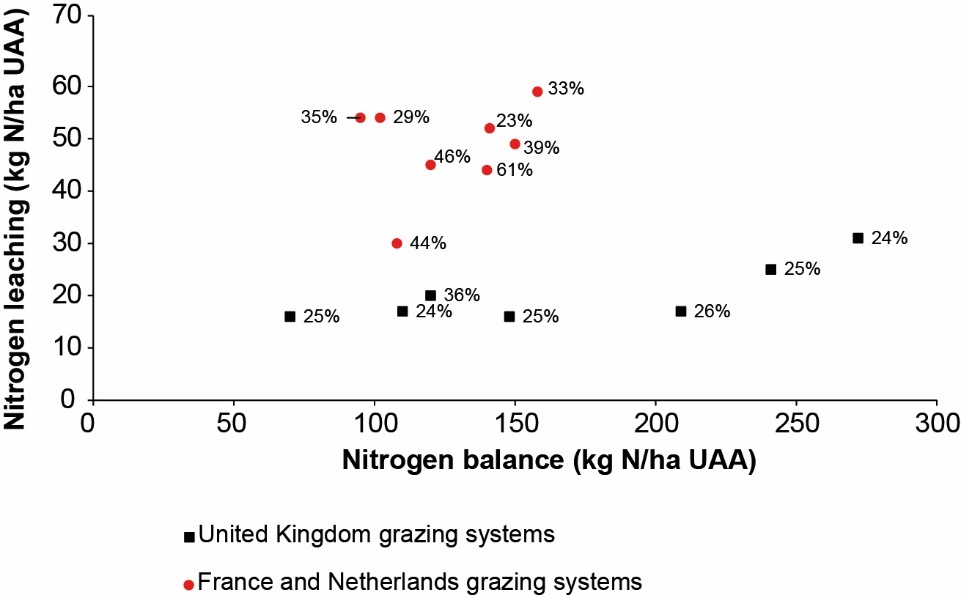
The Green Dairy project also showed that nitrate leaching was greater in dairy systems based on forage crops with rapid rotations such as grasslands/crops (e.g. in France, Netherlands), despite lower N balances and/or better NUE than those of grassland systems based on more perennial grasslands (e.g. in Ireland). Thus, although N balances may be similar, the influence of agricultural practices and the sensitivity of the environment will result in different environmental impacts (Figure 4).
Figure 4. Nitrogen (N) leached as a function of the farm-level N balance for grassland systems in the United Kingdom (UK), France and the Netherlands (Raison et al., 2008).
4. Utility and limitations of nitrogen-use efficiency indicators
Efficiency seems to be a relatively simple criterion to calculate and use to optimise a system at a given time and spatial scale. However, it is important to verify that practices that are more efficient at the animal or field level remain useful at the farm or regional level. Moreover, efficient farms can generate high environmental impacts. This is usually true for the most intensive farms, on which the stocking rate exceeds the production capacity of the associated land and requires importing inputs, some of which are not used and thus degrade the environment. Thus, efficiencies must always be interpreted in relation to the N balance (Godinot et al., 2014; EU Nitrogen Expert Panel, 2015). For example, NUE does not consider N losses associated with the manufacture of purchased inputs (e.g. feed, fertilisers) or changes in soil N stocks (Godinot et al., 2014). Recent studies recommend changing the calculation of NUE to correct the main biases (Quemada et al., 2020) and avoid externalising impacts to other regions (e.g. those that produce imported feed).
NUE’s main advantage is that it focuses on a single element, which it makes it a relatively simple indicator to calculate, understand and compare. However, this also becomes its main limitation when trying to understand other important dimensions of dairy farming, such as greenhouse gas emissions and carbon sequestration, the maintenance of biodiversity, the contribution to employment or landscape maintenance, or the nutritional or cultural value of dairy products. The NUE and N balance indicators aggregate all forms of N into a common unit (kg N), which facilitates analysis and comparison of production systems and provides an integrated view of agricultural production and its impacts. However, these indicators cannot distinguish the forms of N lost (e.g. NH3, nitrate, N2O). Some practices that reduce nitrate losses could increase losses of N2O or NH3 (the “hole in the pipe” model; Figure 3). Thus, it is necessary to consider integrated N management and the multiple impacts caused by N losses in different forms at different scales. Life-cycle methods are good approaches to address this limitation.
NUE has attracted political interest due to its relevance and relatively simple calculation at different spatial and temporal scales. However, crop production often has much better NUE than livestock production, even though new approaches and consideration of the proportion of crop production that humans cannot consume directly now provide a new, more positive view of the efficiency of livestock production (e.g. "net" efficiency, Laisse et al., 2018). Consequently, at the regional or country scale, the main factor that influences efficiency is the relative proportions of crop and livestock production (Leip et al., 2011; Godinot et al., 2016). For a country such as France, the national mean efficiency masks large differences among regions due to different soil and climate contexts and agricultural orientations. Thus, it is challenging to recommend a national or even regional efficiency threshold without considering the type of agricultural production, agronomic potential and sensitivity of natural environments to pollution. A relative efficiency indicator was developed to address this limitation (Godinot et al., 2015). It demonstrates benefits of researching efficiency indicators to improve them and adapt them to different uses, from agricultural advice at the farm level to global environmental assessments and regional, national or European public policies.
Conclusion
Improving the NUE of cattle farming is often recommended to improve the environmental profile of animal products (milk and meat). This synthesis highlights that many mechanisms exist at different scales to better use N resources in dairy systems, and thus improve the latter’s efficiency. These mechanisms can often reduce N losses to the environment as well as production costs, especially by reducing inputs. However, efficiency cannot be addressed alone due to the risk of encouraging the intensification of systems without reducing losses, as observed in some European countries. Similarly, at the regional level, seeking maximum efficiency could lead to standardising production systems, which would have negative consequences on environmental, economic and social dimensions. Relocating farms to low farm-density areas, which seems attractive due to its positive impact, is difficult to envision without a strong incentive policy. Redistributing N and other nutrients by transferring animal waste, another product of livestock farming with multiple agronomic benefits, to crops and between regions should be encouraged to close nutrient cycles and develop a circular bioeconomy. N management must improve N use at all levels, as well as their interactions, to reduce waste, and decrease N losses to ensure a good environmental status. Therefore, NUE and the N balance are essential and complementary indicators.
Acknowledgements
We thank all members of UMT RIEL (Unité Mixte Technologique Recherche et Ingénierie en Élevage Laitier; INRAE, Institut Agro and IDELE) for constructive discussions during meetings, which resulted in this synthesis, as well as the reviewers and editor for their relevant and appreciated suggestions. This article was first translated with www.DeepL.com/Translator, and reviewed by all the authors. We thank Michelle and Michael Corson for their English corrections.
Notes
- The gross operating surplus (GOS) equals the gross product (sales + subsidies ± changes in inventory) minus operating and structural costs (excluding depreciation and financial costs).
References
- Aarts H.F.M., Habekotté B., Van Keulen H., 2000. Nitrogen (N) management in the 'De Marke' dairy farming system. Nutr. Cycl. Agroecosystems, 56, 231-240. doi:10.1023/A:1009885419512
- Arndt C., Powell J.M., Aguerre M.J., Wattiaux M.A., 2015. Performance, digestion, nitrogen balance, and emission of manure ammonia, enteric methane, and carbon dioxide in lactating cows fed diets with varying alfalfa silage-to-corn silage ratios. J. Dairy Sci., 98, 418-430. doi:10.3168/jds.2014-8298
- Bodirsky B.L., Popp A., Lotze-Campen H., Dietrich J.P., Rolinski S., Weindl I., Schmitz C., Müller C., Bonsch M., Humpenöder F., Biewald A., Stevanovic M., 2014. Reactive nitrogen requirements to feed the world in 2050 and potential to mitigate nitrogen pollution. Nat. Commun., 5, 1-7. doi:10.1038/ncomms4858
- Broderick G.A., Stevenson M.J., Patton R.A., 2009. Effect of dietary protein concentration and degradability on response to rumen-protected methionine in lactating dairy cows. J. Dairy Sci., 92, 2719-2728. doi:10.3168/jds.2008-1277
- Brun-Lafleur L., Delaby L., Husson F., Faverdin P., 2010. Predicting energy × protein interaction on milk yield and milk composition in dairy cows. J. Dairy Sci., 93, 4128-4143. doi:10.3168/jds.2009-2669
- Buckley C., Wall D.P., Moran B., O'Neill S., Murphy P.N., 2016. Farm gate level nitrogen balance and use efficiency changes post implementation of the EU Nitrates Directive. Nutr. Cycl. Agroecosystems, 104, 1-13. doi:10.1007/s10705-015-9753-y
- Bussink D., Oenema O., 1998. Ammonia volatilization from dairy farming systems in temperate areas: a review. Nutr. Cycl. Agroecosystems, 51, 19-33. doi:10.1023/A:1009747109538
- Campbell B.M., Beare D.J., Bennett E.M., Hall-Spencer J.M., Ingram J.S.I., Jaramillo F., Ortiz R., Ramankutty N., Sayer J.A., Shindell D., 2017. Agriculture production as a major driver of the Earth system exceeding planetary boundaries. Ecol. Soc., 22. doi:10.5751/ES-09595-220408
- Cantalapiedra-Hijar G., Ortigues-Marty I., Lemosquet S., 2015. Diets rich in starch improve the efficiency of amino acids use by the mammary gland in lactating Jersey cows. J. Dairy Sci., 98, 6939-6953. doi:10.3168/jds.2015-9518
- Castellan E., Fourdin S., Godoc B., 2021. Impacts environnementaux et stratégies économiques des exploitations laitières. Etude du lien entre performance économique et performance environnementale en système bovin lait., Collection L'Essentiel. Idele, Paris, France.
- Castillo A.R., Kebreab E., Beever D.E., France J., 2000. A review of efficiency of nitrogen utilisation in lactating dairy cows and its relationship with environmental pollution. J. Anim. Feed Sci., 9, 1-32. doi:10.22358/jafs/68025/2000
- Dalgaard T., Hansen B., Hasler B., Hertel O., Hutchings N.J., Jacobsen B.H., Jensen L.., Kronvang B., Olesen J.E., Schjørring J.K., Kristensen I.S., Graversgaard M., Termansen M., Vejre H., 2014. Policies for agricultural nitrogen management-trends, challenges and prospects for improved efficiency in Denmark. Environ. Res. Letters, 9, 115002. doi:10.1088/1748-9326/9/11/115002
- Delaby L., Peyraud J., Vérité R., Marquis B., 1996. Effect of protein content in the concentrate and level of nitrogen fertilization on the performance of dairy cows in pasture. Ann. Zootech., 45, 327-341. doi:10.1051/animres:19960405
- Dillon P., Shalloo L., Ruelle E., Delaby L., Fenton O., Crosson P., Creighton P., O'Donovan M., Horan B., Wall D., Hennessy D., Mccarthy B., Richards K., O'Brien D., Herron J., Mellander P.E., O'Sullivan L., Tuohy P., Spink J., Egan M., 2020. Review of the influence of chemical nitrogen application rate, soil type and agroclimate location on grass production, feed budgets, nitrogen use efficiency, environmental impact and farm profitability (report). Teagasc.
- Duan Y., Xu M., Gao S., Yang X., Huang S., Liu H., Wang B., 2014. Nitrogen use efficiency in a wheat-corn cropping system from 15 years of manure and fertilizer applications. Field Crops Res. 157, 47-56. doi:10.1016/j.fcr.2013.12.012
- Edouard N., Alves T.P., Genermont S., Raynal J., Lorinquer E., 2015. Emissions d'ammoniac au bâtiment, au stockage et à l'épandage de fumiers produits par des vaches laitières selon deux rations contrastées. Renc. Rech. Rum., 22, 76.
- Edouard N., Hassouna M., Robin P., Faverdin P., 2016. Low degradable protein supply to increase nitrogen efficiency in lactating dairy cows and reduce environmental impacts at barn level. Animal, 10, 212-220. doi:10.1017/S1751731115002050
- Edouard N., Charpiot A., Robin P., Lorinquer E., Dollé J.B., Faverdin P., 2019. Influence of diet and manure management on ammonia and greenhouse gas emissions from dairy barns. Animal, 13, 2903-2912. doi:10.1017/S1751731119001368
- Erisman J.W., Sutton M.A., Galloway J.N., Klimont Z., Winiwarter W., 2008. How a century of ammonia synthesis changed the world. Nat. Geosci. 1, 636-639. doi:10.1038/ngeo325
- EU Nitrogen Expert Panel, 2015. Nitrogen Use Efficiency (NUE) - an indicator for the utilization of nitrogen in agriculture and food systems. Wageningen University, Alterra, PO Box 47, NL-6700 Wageningen, Netherlands.
- European Environment Agency, 2019. The European environment - state and outlook 2020. Knowledge for transition to a sustainable Europe, 496p. doi:10.2800/96749
- Ewing P.M., Runck B.C., 2015. Optimizing nitrogen rates in the midwestern United States for maximum ecosystem value. Ecol. Soc., 20. doi:10.5751/ES-06767-200118
- Faverdin P., Van Milgen J., 2019. Intégrer les changements d'échelle pour améliorer l'efficience des productions animales et réduire les rejets. In : Numéro spécial, De grands défis et des solutions pour l’élevage. Baumont R. (Éd). INRA Prod. Anim., 305-322. doi:10.20870/productions-animales.2019.32.2.2499
- Foray S., Leroy S., 2018. Projet collaboratif "Évaluation socio-économique aux changements de pratiques en agriculture" dans le bassin-versant du Couesnon, évaluation environnementale des scénarios agricoles définis sur le territoire. Résultats, Idele. 34p. https://www.creseb.fr/voy_content/uploads/2021/04/Prospective-evolution-pratiques-agricole_volet-environnement_2018.pdf
- Foray S., Manneville V., 2019. A la reconquête de la qualité de l'eau en France. Impact de l'élevage sur les pollutions nitriques, Dossiers Techniques de l'Élevage. Idele. https://idele.fr/?eID=cmis_download&oID=workspace://SpacesStore/04cc4a2f-3a8b-46b7-912f-f90328f5def3
- Foray S., Billy C., Manneville V., Dollé J.B., Vertès F., Godinot O., 2017. Gestion de l'azote dans les systèmes d'élevages herbivores. Evaluation et amélioration de l'efficience de l'azote, réduction des transferts vers les milieux aquatiques, Collection Résultats Idele. https://idele.fr/fileadmin/medias/Documents/MAA_Effluent/Efficience_de_l_azote_en_elevages_herbivores_Idele_AFB.pdf
- Foray S., Vertès F., Godinot O., 2018. Nitrogen management in french dairy systems: Evaluation and enhancement of nitrogen efficiency and economic performance. 20th N Workshop - Coupling C-N-P-S cycles, Rennes, France, 107-109.Aarts, H.F.M., Habekotté, B., Van Keulen, H., 2000. Nitrogen (N) management in the 'De Marke' dairy farming system. Nutr. Cycl. Agroecosystems, 56, 231-240. doi:10.1023/A:1009885419512
- Foray S., Oenema J., Brocard V., Fagon J., Merino P., Rankin J., Menghi A., Loges R., Campos M.R., Trindad H., Andersen, T., 2019. Report of best practice performance potential on resource efficiency. Eurodairy project. https://ec.europa.eu/research/participants/documents/downloadPublic?documentIds=080166e5cc53f92b&appId=PPGMS
- Foray S., Gaborit M., Launay F., Delaby L., 2020. Stratégie d'alimentation, race, âge au 1er vêlage et taux de renouvellement : Évaluation intégrée de leur influence sur l'empreinte carbone du lait et les pertes azotées à l'échelle du système laitier. Renc. Rech. Rum., 25, 115-119.
- Godinot O., Carof M., Vertès F., Leterme P., 2014. SyNE: An improved indicator to assess nitrogen efficiency of farming systems. Agric. Syst., 127, 41-52. doi:10.1016/j.agsy.2014.01.003
- Godinot O., Leterme P., Vertès F., Faverdin P., Carof M., 2015. Relative nitrogen efficiency, a new indicator to assess crop livestock farming systems. Agron. Sustain. Dev., 35, 857-868. doi:10.1007/s13593-015-0281-6
- Godinot O., Leterme P., Vertès F., Carof M., 2016. Indicators to evaluate agricultural nitrogen efficiency of the 27 member states of the Eur. Union. Ecol. Indic., 66, 612-622. doi:10.1016/j.ecolind.2016.02.007
- Haque M.N., Rulquin H., Andrade A., Faverdin P., Peyraud J.L., Lemosquet S., 2012. Milk protein synthesis in response to the provision of an "ideal" amino acid profile at 2 levels of metabolizable protein supply in dairy cows. J. Dairy Sci., 95, 5876-5887. doi:10.3168/jds.2011-5230
- Haque M.N., Guinard-Flament J., Lamberton P., Mustière C., Lemosquet S., 2015. Changes in mammary metabolism in response to the provision of an ideal amino acid profile at 2 levels of metabolizable protein supply in dairy cows: Consequences on efficiency. J. Dairy Sci., 98, 3951-3968. doi:10.3168/jds.2014-8656
- Hawkesford M.J., Griffiths S., 2019. Exploiting genetic variation in nitrogen use efficiency for cereal crop improvement. Curr. Opin. Plant Biol., Physiol. Metabol., 49, 35-42. doi:10.1016/j.pbi.2019.05.003
- Huhtanen P., Hristov A.N., 2009. A meta-analysis of the effects of dietary protein concentration and degradability on milk protein yield and milk N efficiency in dairy cows. J. Dairy Sci., 92, 3222-3232. doi:10.3168/jds.2008-1352
- INRA, 2007. Alimentation des bovins, ovins et caprins : besoins des animaux, valeurs des aliments. Tables Inra 2007, Éditions Quae, Paris, France.
- INRA, 2018. Alimentation des ruminants : Apports nutritionnels - Besoins et réponses des animaux - Rationnement - Tables des valeurs des aliments. Ed. Quae, Paris, France. 728 p.
- Kupper T., Häni C., Neftel A., Kincaid C., Bühler M., Amon B., VanderZaag A., 2020. Ammonia and greenhouse gas emissions from slurry storage - A review. Agric. Ecosyst. Environ., 300, 106963. doi:10.1016/j.agee.2020.106963
- Laisse S., Baumont R., Dusart L., Gaudré D., Rouillé B., Benoit M., Veysset P., Rémond D., Peyraud J.L., 2018. L'efficience nette de conversion des aliments par les animaux d'élevage : une nouvelle approche pour évaluer la contribution de l'élevage à l'alimentation humaine. In : Ressources alimentaires pour les animaux d’élevage. Baumont R. (Ed). Dossier, INRA Prod. Anim., 31, 269-288. doi:10.20870/productions-animales.2018.31.3.2355
- Lassaletta L., Billen G., Grizzetti B., Anglade J., Garnier J., 2014. 50-year trends in nitrogen use efficiency of world cropping systems: the relationship between yield and nitrogen input to cropland. Environ. Res. Lett., 9, 105011. doi:10.1088/1748-9326/9/10/105011
- Leip A., Britz W., Weiss F., de Vries W., 2011. Farm, land, and soil nitrogen budgets for agriculture in Europe calculated with CAPRI. Environ. Pollut., 159, 3243-3253. doi:10.1016/j.envpol.2011.01.040
- Lemosquet S., Haque M.N., Faverdin P., Peyraud J.L., Delaby L., 2014. À bas comme à hauts niveaux d'apports PD I, corriger le profil en acides aminés digestibles dans l'intestin permet d'augmenter les matières protéiques du lait et l'efficience d'utilisation des PDI chez la vache laitière. Renc. Rech. Rum., 21, 139-142.
- Li T., Zhang W., Yin J., Chadwick D., Norse D., Lu Y., Liu X., Chen X., Zhang F., Powlson D., Dou Z., 2018. Enhanced-efficiency fertilizers are not a panacea for resolving the nitrogen problem. Glob. Change Biol., 24, e511-e521. doi:10.1111/gcb.13918
- Li T., Zhang X., Gao H., Li B., Wang H., Yan Q., Ollenburger M., Zhang W., 2019. Exploring optimal nitrogen management practices within site-specific ecological and socioeconomic conditions. J. Clean. Prod., 241, 118295. doi:10.1016/j.jclepro.2019.118295
- Martin G., Moraine M., Ryschawy J., Magne M.A., Asai M., Sarthou J.P., Duru M., Therond O., 2016. Crop-livestock integration beyond the farm level: a review. Agron. Sustain. Dev., 36, 53. doi:10.1007/s13593-016-0390-x
- Mitscherlich E.A., 1924. Die Bestimung des Düngerbedürfnisses des Bodens. Ed. Parey, Berlin, Allemagne, 100p.
- Moraine M., Grimaldi J., Murgue C., Duru M., Therond O., 2016. Co-design and assessment of cropping systems for developing crop-livestock integration at the territory level. Agric. Syst., 147, 87-97. doi:10.1016/j.agsy.2016.06.002
- Mueller N.D., West P.C., Gerber J.S., MacDonald G.K., Polasky S., Foley J.A., 2014. A tradeoff frontier for global nitrogen use and cereal production. Environ. Res. Lett., 9, 054002. doi:10.1088/1748-9326/9/5/054002
- Mueller N.D., Lassaletta L., Runck B.C., Billen G., Garnier J., Gerber J.S., 2017. Declining spatial efficiency of global cropland nitrogen allocation. Glob. Biogeochem. Cycles, 31, 245-257. doi:10.1002/2016GB005515
- Oenema O., Witzke H.P., Klimont Z., Lesschen J.P., Velthof G.L., 2009. Integrated assessment of promising measures to decrease nitrogen losses from agriculture in EU-27. Agric. Ecosyst. Environ., 133, 280-288. doi:10.1016/j.agee.2009.04.025
- Pellerin S., Bamière L., Angers D., Béline F., Benoit M., Butault J.P., Chenu C., Colnenne-David C., de Cara S., Delame N., Doreau M., Dupraz P., Faverdin P., Garcia-Launay F., Hassouna M., Hénault C., Jeuffroy M.H., Klumpp K., Metay A., Moran D., Recous S., Samson E., Savini I., Pardon L., 2013. Quelle contribution de l'agriculture française à la réduction des émissions de gaz à effet de serre ? Potentiel d'atténuation et coût de dix actions techniques. Synthèse du rapport d'étude. INRA 92. doi:10.15454/RGFM-WH23
- Peyraud J.L., Vérité R., Delaby L., 1995. Rejets azotés chez la vache laitière : effets du type d’alimentation et du niveau de production des animaux. Fourrages, 142, 131-144.
- Peyraud J.L., Cellier P., Aarts H.F.M., Béline F., Bockstaller C., Bourblanc M., Delaby L., Donnars C., Dourmad J.Y., Dupraz P., Durand P., Faverdin P., Fiorelli J.L., Gaigné C., Girard A., Guillaume F., Kuikman P., Langlais A., Le Goffe P., Le Perchec S., Lescoat, P., Morvan, T., Nicourt, C., Parnaudeau, V., Peyraud, J.L., Réchauchère, O., Rochette P., Vertès F., Veysset P., 2012a. Les flux d’azote liés aux élevages, réduire les pertes, rétablir les équilibres. Expertise scientifique collective, INRA, Paris, France. 527p.
- Peyraud J.L., Delaby L., Dourmad J.Y., Faverdin P., Morvan T., Vertès F., 2012b. Les systèmes de polyculture-élevage pour bien valoriser l’azote. Innov. Agron., 45-69.
- Powell J.M., Gourley C.J.P., Rotz C.A., Weaver D.M., 2010. Nitrogen use efficiency: A potential performance indicator and policy tool for dairy farms. Environ. Sci. Policy, 13, 217-228. doi:10.1016/j.envsci.2010.03.007
- Quemada M., Lassaletta L., Jensen L.S., Godinot O., Brentrup F., Buckley C., Foray S., Hvid S.K., Oenema J., Richards K.G., Oenema O., 2020. Exploring nitrogen indicators of farm performance among farm types across several European case studies. Agric. Syst., 177, 102689. doi:10.1016/j.agsy.2019.102689
- Raggio G., Pacheco D., Berthiaume R., Lobley G.E., Pellerin D., Allard G., Dubreuil P., Lapierre H., 2004. Effect of Level of Metabolizable Protein on Splanchnic Flux of Amino Acids in Lactating Dairy Cows. J. Dairy Sci., 87, 3461-3472. doi:10.3168/jds.S0022-0302(04)73481-5
- Raison C., Chambaut H., Le Gall A., Pflimlin A., 2008. Impact du système fourrager sur la qualité de l'eau. Enseignements issus du projet Green Dairy. Fourrages, 193, 3-18.
- Regan J.T., Marton S., Barrantes O., Ruane E., Hanegraaf M., Berland J., Korevaar H., Pellerin S., Nesme T., 2017. Does the recoupling of dairy and crop production via cooperation between farms generate environmental benefits? A case-study approach in Europe. Eur. J. Agron., Farming systems analysis and design for sustainable intensification: new methods and assessments 82, 342-356. doi:10.1016/j.eja.2016.08.005
- Réseau CIVAM, 2021. L'observatoire technico-économique des systèmes bovins laitiers. Exercice comptable 2018. 16p. Lien rapport.
- Richard M., Carlier M., Chotteau P., Foray S., 2017. La filière laitière en Nouvelle-Zélande rattrapée par les exigences de durabilité. Dossiers Économie de l’Élevage, 484. Idele.
- Rigout S., Hurtaud C., Lemosquet S., Bach A., Rulquin H., 2003. Lactational Effect of Propionic Acid and Duodenal Glucose in Cows. J. Dairy Sci., 86, 243-253. doi:10.3168/jds.S0022-0302(03)73603-0
- Rouillé B., Devun J., Brunschwig P., 2014. L'autonomie alimentaire des élevages bovins français. OCL 21, D404. doi:10.1051/ocl/2014017
- Russelle, M.P., Entz, M.H., Franzluebbers, A.J., 2007. Reconsidering Integrated Crop-Livestock Systems in North America. Agron., J. 99, 325-334. doi:10.2134/agronj2006.0139
- Ryschawy J., Martin G., Moraine M., Duru M., Therond O., 2017. Designing crop-livestock integration at different levels: Toward new agroecological models? Nutr. Cycl. Agroecosyst., 108, 5-20. doi:10.1007/s10705-016-9815-9
- Schröder J.J., Aarts H.F.M., ten Berge H.F.M., van Keulen H., Neeteson J.J., 2003. An evaluation of whole-farm nitrogen balances and related indices for efficient nitrogen use. Eur. J. Agron., 20, 33-44. doi:10.1016/S1161-0301(03)00070-4
- Simon J., Le Corre L., 1992. Le bilan apparent de l’azote à l’échelle de l’exploitation agricole : méthodologie, exemples de résultats. Fourrages, 129, 79-94.
- Steffen W., Richardson K., Rockstrom J., Cornell S.E., Fetzer I., Bennett E.M., Biggs R., Carpenter S.R., de Vries W., de Wit C.A., Folke C., Gerten D., Heinke J., Mace G.M., Persson L.M., Ramanathan V., Reyers B., Sorlin S., 2015. Planetary boundaries: Guiding human development on a changing planet. Science. doi:10.1126/science.1259855
- Sutton M.A., Howard C.M., Erisman J.W., Billen G., Bleeker A., Grennfelt P., van Grinsven, H., Grizzetti, B., 2011. The European nitrogen assessment: sources, effects, and policy perspectives. Cambridge University Press, Cambridge, United Kingdom.
- Thomas I.A., Buckley C., Kelly E., Dillon E., Lynch J., Moran B., Hennessy T., Murphy P.N.C., 2020. Establishing nationally representative benchmarks of farm-gate nitrogen and phosphorus balances and use efficiencies on Irish farms to encourage improvements. Sci. Total Environ., 720, 137245. doi:10.1016/j.scitotenv.2020.137245
- Van der Hoek K.W., 1998. Nitrogen efficiency in global animal production. Environ. Pollut., 102, 127-132. doi:10.1016/S0269-7491(98)80025-0
- Vérité R., Delaby L., 2000. Relation between nutrition, performances and nitrogen excretion in dairy cows. Ann. Zootech., 49, 217-230. doi:10.1051/animres:2000101
- Wilkins R.J., 2008. Eco-efficient approaches to land management: a case for increased integration of crop and animal production systems. Philos. Trans. R. Soc. B Biol. Sci., 363, 517-525. doi:10.1098/rstb.2007.2167
- Zebarth B.J., Paul J.W., Van Kleeck R., 1999. The effect of nitrogen management in agricultural production on water and air quality: evaluation on a regional scale. Agric. Ecosyst. Environ., 72, 35-52. doi:10.1016/S0167-8809(98)00160-1
- Godinot O., Foray S., Lemosquet S., Delaby L., Edouard N., 2022. De l’animal au territoire, regards sur l’efficience de l’azote dans les systèmes bovins laitiers. INRAE Prod. Anim., 35, pages
Abstract
Improving the use of nitrogen at all stages of its use is a priority, especially in livestock systems where it remains relatively low. There are many
nitrogen use efficiency indicators based on various calculations depending on the context and the scales considered. The literature is full of examples
of win-win practices improving its use and reducing its losses to the environment. But few studies present an integrative view of these gains at
supra scales. This article first recalls the main strategies for increasing nitrogen use efficiency at the animal, farm and territory levels. The analysis
of the integration of gains at global levels shows that improving efficiency at a given scale does not systematically generate an efficiency gain at
larger scales or for the whole system. Moreover, the search for high efficiency does not always allow a reduction in nitrogen losses, some of the most
efficient systems are also those that generate the highest impacts, a consequence of the high levels of N used. Efficiency indicators remain useful
tools for improving nitrogen use in agricultural systems, but should be consistently associated with nitrogen loss indicators to better consider the
consequences of agricultural systems on the environment.
Attachments
No supporting information for this articleArticle statistics
 Views: 6122
Downloads
 PDF: 233
 XML: 60
Most read articles by the same author(s)
- Audrey MICHAUD, Sylvain PLANTUREUX, René BAUMONT, Luc DELABY, Grasslands, a source of wealth and support for innovation for more sustainable and acceptable ruminant livestock farming , INRAE Productions Animales: Vol. 33 No. 3 (2020)
- Nathan BALANDRAUD, Claire MOSNIER, Luc DELABY, François DUBIEF, Jean-Philippe GORON, Bruno MARTIN, Dominique POMIES, Anaël CASSARD, Holstein or Montbeliarde: from phenotypic differences to economic consequences at the farm level , INRAE Productions Animales: Vol. 31 No. 4 (2018)
- Didier BOICHARD, Sandra DOMINIQUE, Marie BÉRODIER, Sébastien FRITZ, Luc DELABY, Corentin FOUÉRÉ, Mekki BOUSSAHA, Anne BARBAT, Use of sexed semen in cattle production , INRAE Productions Animales: Vol. 37 No. 4 (2024)
- Aurélie MADRID, Renée DE CRÉMOUX, Luc DELABY, Hélène LARROQUE, Sandra NOVAK, Aurélie VINET, Will ruminant farming adapt to climate change? Impacts and levers for adaptation , INRAE Productions Animales: Vol. 38 No. 2 (2025)
- Hervé GUYOMARD, Zohra BOUAMRA-MECHEMACHE, Vincent CHATELLIER, Luc DELABY, Cécile DÉTANG-DÉSSENDRE, Jean-Louis PEYRAUD, Vincent RÉQUILLART, Why and how to regulate animal production and consumption in the EU? , INRAE Productions Animales: Vol. 34 No. 3 (2021)
- Luc DELABY, Brendan HORAN, Improved efficiency in temperate grass based dairy systems , INRAE Productions Animales: Vol. 34 No. 3 (2021)
- Pierre NOZIÈRE, René BAUMONT, Anne BOUDON, Rémy DELAGARDE, Philippe HASSOUN, Sophie LEMOSQUET, Gaëlle MAXIN, Bernard SEPCHAT, Luc DELABY, The INRA 2018 feeding system for ruminants. 2. Application to rationing , INRAE Productions Animales: Vol. 39 No. 2 (2026)
- M. TAGHIPOOR, Sophie LEMOSQUET, J. VAN MILGEN, A. SIEGEL, D. SAUVANT, F. GONDRET, Modelling of metabolic flexibility: toward a better understanding of animal adaptive capacities , INRAE Productions Animales: Vol. 29 No. 3 (2016)
- Pierre NOZIÈRE, René, Anne BOUDON, Rémy DELAGARDE, Philippe HASSOUN, Sophie LEMOSQUET, Gaëlle MAXIN, Bernard SEPCHAT, Luc DELABY, The INRA 2018 feeding system for ruminants. 1. Conceptual foundations and specific features , INRAE Productions Animales: Vol. 39 No. 2 (2026)
- Henri LAGARDE, Pauline Martin, Philippe Barre, René Baumont, Mickaël Brochard, Philippine Coeugnet, Pascal Croiseau, Luc Delaby, Anne De la Torre, Nicolas C. Friggens, Raphael Guatteo, Frédéric Joly, Hélène Leclerc, Marie-Angelina Magne, Sandra Novak, Christophe Perrot, Laurent Schibler, Patrick Veysset, Aurélie Vinet, Didier Boichard, Challenges and directions for bovine genetic selection in France by 2040: Proposals arising from a collective reflection , INRAE Productions Animales: Vol. 39 No. 2 (2026)