
Sustainability of dairy development: reflections on a few cases in the world (Full text available in English)
Chapeau
The dairy sector is one of the pillars of global food security, despite its diversity among countries. This multidisciplinary review discusses several key elements of sustainability (i.e. labor and gender, water, and diversity), with a specific focus on developing countries.
Introduction
According to FAO (Food and Agriculture Organization of the United Nations) estimates, ca. 150 million households (i.e. 750-895 million people) worldwide are engaged in milk production (Hemme and Otte, 2010). In most developing countries, milk is produced in small facilities and contributes significantly to household livelihoods, food security, and nutrition. Dairy development generates many benefits for farmers, milk collectors, and dairy processors (Udo et al., 2011). In industrialized regions such as the European Union (EU), the United States of America (US), New Zealand, and Australia, milk production exceeds domestic demand, which encourages exports to countries that do not produce enough. Depending on the country, the dairy sector involves a variety of production models, animal species, breeds, connections to production zones, actors, public policies, and human diets.
These
diverse models have evolved over time and may need to be transformed to
meet future food needs of the growing global population, which is
projected to reach nearly 10 billion in 2050 (Willett et al., 2019).
Doing so requires promoting more sustainable development models for the
dairy sector. According to the FAO, the transition towards sustainable
food production and agricultural practices requires equal focus on the
social, environmental, and economic dimensions. It also requires
following five principles: (i) increasing the efficiency of resource use; (ii) taking direct action to conserve, protect, and develop natural resources; (iii) protecting and improving rural livelihoods and social well-being; (iv)
increasing the resilience of people, communities, and ecosystems,
especially to address climate change and market volatility; and (v)
using good governance to ensure the sustainability of both natural and
human systems. The complex issue of the sustainability of the dairy
sector is an essential part of the biennial multidisciplinary meetings
"Milk, a Vector for Development"
Within this context, this article reviews sustainable development in the dairy sector, focusing mainly on developing countries and on three key resources: labor, water, and the diversity of livestock species and dairy products (Hoekstra, 2012; Cournut et al., 2018). This article is organized in three parts:
i) A brief overview of the diverse dynamics of development of the dairy sector worldwide. It highlights the important role of Asian countries, including India, in dynamics of global milk production and consumption. It also highlights that most exports of dairy products come from a few industrialized countries and include a high percentage of processed products (including milk powder).
ii) The three key resources for sustainability: labor, water, and diversity. The first subsection describes the social dimension, with a focus on farm work and gender issues. Since family farming includes post-production activities, such as processing and marketing, it is an important source of income in some rural areas. According to the FAO, family farmers make up more than 80% of agricultural households and women play a key role, making up ca. 43% of the agricultural labor force in developing countries. The second subsection addresses water resources, which is of increasing concern in the context of climate change. Animal feed in this sector is produced by using large areas of natural (permanent grassland) or cultivated fodder, with relatively intensive use of irrigation, depending on the area. The third subsection addresses the diversity of the dairy sector, focusing on the high diversity of livestock species involved and the variety of methods used to optimize milk production.
iii) An overview of developments in the global trade in milk and milk derivatives. Due to production challenges and/or sustained dynamics of domestic demand, trade in dairy products can enable countries with a deficit of milk production to meet their domestic demand. In some developing countries; however, reliance on inexpensive imports could discourage expansion of domestic production.
1. Diversity of dynamics of production and consumption of milk in major areas of the world
This first section presents key elements of the dynamics of milk production and consumption of milk from all species. This information is necessary to consider the world dairy sector and to place the geographically focused analyses in a global context.
1.1. Global milk production and consumption
Globally, per capita food
consumption (expressed as calorie intake (kcal) per year) is increasing,
although there are large differences among geographic regions.
According to estimates of the FAO and the Organization for Economic
Cooperation and Development (OECD
Figure 1. Contribution of food sources to total daily intake of calories (kcal/capita) of populations in different countries/regions in 2006, 2016, and 2026 (projected) (Source: OECD-FAO, 2018).

While highlighting the importance of cereals in the diet, these data indicate that the percentage of cereals in the diet is decreasing in countries with the highest incomes (e.g. 54% in India vs. 30% in OECD countries). Dairy products (e.g. fresh milk, butter, cheese, milk powder, ingredients for the prepared-food sector) represent 10.3% of mean per capita calorie intake in OECD member countries (in 2016). While this percentage increases slightly over time (10.6% is projected in 2026), the overall change in the volume consumed globally is low for two main reasons: population growth in OECD countries is lower than that in developing countries (ONU, 2017), and total calorie intake is no longer increasing. While the percentage of dairy products in total calorie intake is expected to increase in many countries over the next decade, it remains low in Southeast Asia (1.2% in 2016), Sub-Saharan Africa (2.5%), and China (1.9%). In India, which will have a population of 1.26-1.65 billion from 2016-2050 according to UN estimates, the percentage of dairy products is higher (8.8% in 2016 and 10.1% projected in 2026). Developing countries consume mainly fresh dairy products (which sometimes makes it difficult to estimate total consumption), while industrialized countries consume processed products (e.g. cheese, butter) more often.
Globally, per capita consumption of milk from all dairy livestock species equals (in 2017) a mean of 113 kg of milk equivalent (i.e. the amount of fluid milk used in a processed dairy product) (International Dairy Federation, 2018). Mean per capita consumption varies greatly among countries: nearly 300 kg in several EU member states (including France), close to the global mean in India, and much lower in Japan (70 kg), China (ca. 45 kg), and Indonesia (13 kg). Several factors explain these differences, such as historical reasons related to whether dairy production is a traditional activity, cultural reasons related to preferred food models (Dahan and Mingasson, 2016), and economic reasons (e.g. household purchasing power, development of imports) (Dahan and Mingasson, 2016).
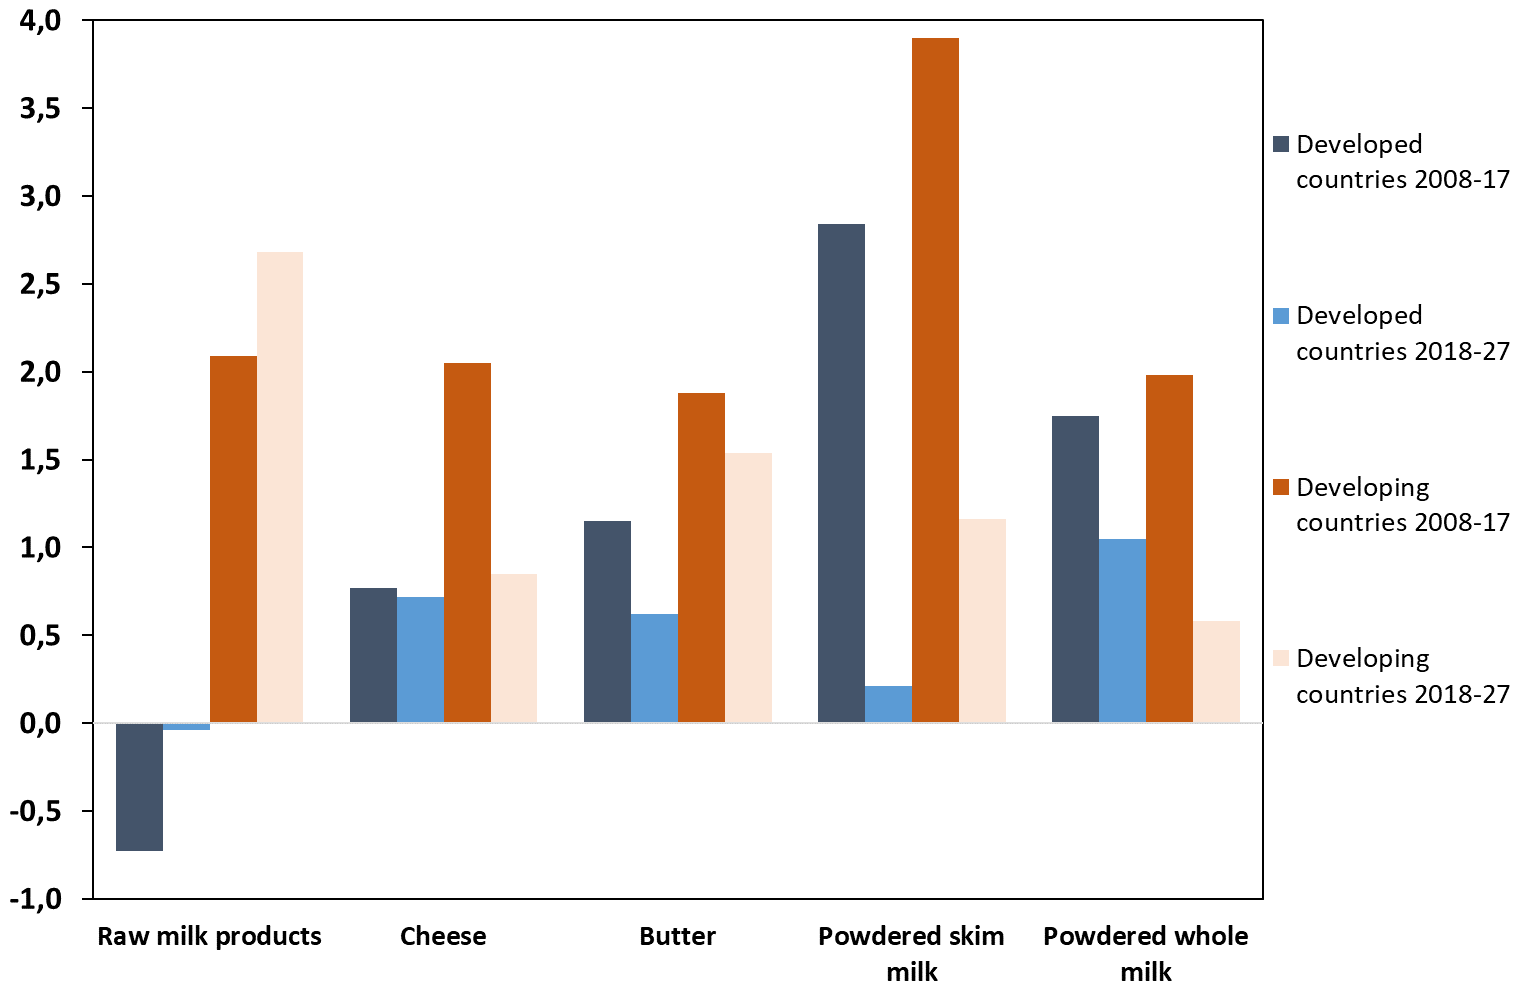
According to the OECD-FAO (2018), global consumption of dairy products could increase by ca. 20% over the next decade (i.e. 2018-2027). This growth rate is higher than that projected for most other agricultural products, including cereals and meat. Approximately half of this increase, mainly from developing countries, is due to projected population growth, and half to the increase in per capita consumption of dairy products. In developed countries, the annual increase in per capita consumption of dairy products, already low during the previous decade, is projected to be even lower over the next decade (2018-2027): 0% for fresh dairy products, 0.2% for skimmed milk powder, 0.6% for butter, 0.7% for cheese, and 1.1% for whole milk powder. However, in many developed countries, including several EU member states, consumption (expressed in milk equivalents) is expected to continue to decrease. In developing countries, projections of dairy consumption are more promising, with an annual increase of 2.7% for fresh products (figure 2). Several factors prompt this increase in consumption (FAO, 2013; FAO, 2017a), which is particularly strong in Asia: increase in mean income; urbanization, which promotes cultural changes and Westernization of food models; individual meals rather than family meals; and technical progress that simplifies distribution of dairy products (e.g. packaging of finished products, improvement in logistics, wider compliance with the cold chain).
Figure 2. Annual growth consumption of dairy products per capita during 2008-2017 and 2018-2027 (projected) in developed and developing countries (Source: OECD-FAO).
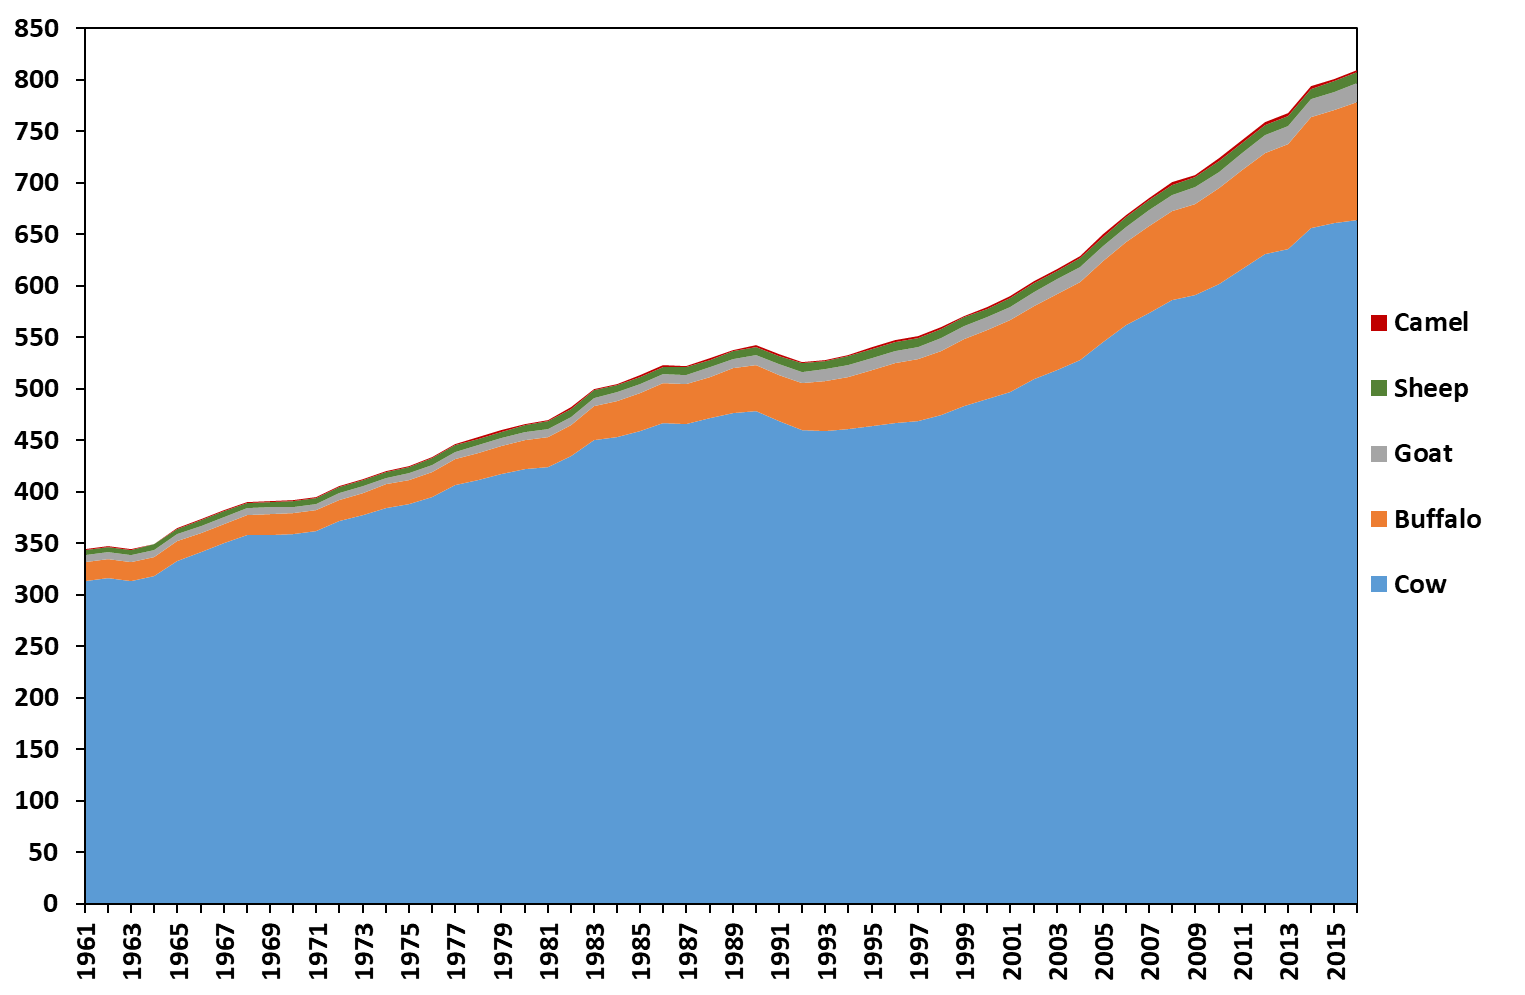
According to FAOSTAT, global milk production from all species has increased considerably over the past few decades, from 344 million t (Mt) in 1961 (91% cow milk) to 809 Mt in 2016 (80% cow milk) (figure 3). From 1961-2016, mean growth in global production was 8.5 Mt per year. This growth rate was higher from 2000-2016 (+14.3 Mt per year) than from 1961-2000 (+6.1 Mt per year). According to the OECD-FAO (2018), milk production over the next decade (2018-2027) is projected to increase by ca. 9% and ca. 33% in developed and developing countries, respectively.
Figure 3. Global milk production by livestock species from 1961-2016 (in Mt) (Source: FAO).
1.2. Regional trends in production and consumption of dairy products
Production systems in the countries that contribute most to global production and consumption of milk differ greatly in farm size, farm structure, labor productivity, land intensification, types of animals, and food self-sufficiency. While improvements in animal genetics and animal production techniques are helping to increase milk production, it remains low in many countries for a variety of reasons. Low production is due in particular to low soil fertility, low or irregular fodder yields, water scarcity, local competition among types of agricultural production, lack of investment, and competitive prices of imported products.
a. Europe
Milk production in Europe reached 224 Mt in 2016 (i.e. 28% of the world total), 30 Mt more than in 1961. With a wide diversity of production models (Pflimlin, 2010) and sustained development in milk production since milk quotas were abandoned in 2015, the EU has a strong global influence (Commission Européenne, 2017). EU imports of dairy products are extremely low (ca. 1% of domestic consumption), and exports represent 12% of domestic production (Chatellier, 2016). Several EU member states have major advantages, such as a temperate climate, high agricultural potential, solid industrial infrastructure, and wide diversity of finished products (Perrot et al., 2018). The combined milk production of the five highest milk-producing member states in 2016 (Germany, France, the United Kingdom, the Netherlands, and Italy, in descending order) was similar to that of the US.
Russia (30.8 Mt in 2016), the Ukraine, Belarus, and Switzerland are non-EU countries that contribute to European production. Livestock and milk production in the Russian dairy sector has decreased over the past 25 years (it was 48 Mt in 1992). The increase in production by large companies cannot compensate for the decrease in that by family-sized farms. Even though Russia stopped purchasing dairy products from the EU since the 2014 embargo (Chatellier et al., 2018), it remains a major importer of dairy products, ranking third in the world after China and the US.
b. Americas
Milk production in the Americas reached 184 Mt in 2016 (23% of the world total), 100 Mt more than in 1961 (Table 1). In 2016, the contribution to milk production in the Americas was 57% for North America (96.4, 11.8 and 8.2 Mt in the US, Mexico and Canada, respectively), 34% for South America (including 33.9 and 10.3 Mt in Brazil and Argentina, respectively) and 9% for Central America. While self-sufficiency in milk is less than 100% in Central America (79%), it ca. 100% in South America and nearly 110% in North America.
Table 1. Milk production (all species) in several areas/countries of the world (millions of t (Mt)) from 1961-2016 (Source: FAO). “nd” = no data
Milk production (Mt) |
Change in production |
|||||
|---|---|---|---|---|---|---|
1961 |
1980 |
2000 |
2016 |
2016-1961 |
2016-2000 |
|
Europe |
195.0 |
265.5 |
213.2 |
224.8 |
29.8 |
11.6 |
EU - Germany |
25.3 |
32.1 |
28.4 |
32.7 |
7.4 |
4.3 |
EU - France |
19.4 |
27.9 |
23.9 |
25.4 |
6.0 |
1.5 |
EU - United Kingdom |
12.0 |
16.0 |
14.5 |
14.7 |
2.7 |
0.2 |
EU - Netherlands |
7.0 |
11.8 |
11.2 |
14.6 |
7.6 |
3.4 |
EU - Poland |
12.8 |
16.5 |
11.9 |
13.3 |
0.5 |
1.4 |
EU - Italy |
10.6 |
11.4 |
13.3 |
11.4 |
0.8 |
– 1.9 |
EU - Spain |
3.6 |
6.5 |
6.9 |
8.2 |
4.6 |
1.2 |
EU - Ireland |
2.4 |
4.7 |
5.2 |
6.9 |
4.5 |
1.7 |
EU - Denmark |
5.5 |
5.1 |
4.7 |
5.5 |
– 0.1 |
0.7 |
EU - Romania |
2.9 |
4.3 |
4.6 |
4.6 |
1.7 |
0.0 |
EU - Austria |
3.0 |
3.5 |
3.3 |
3.7 |
0.7 |
0.4 |
Russia |
nd |
nd |
32.3 |
30.8 |
nd |
– 1.5 |
Ukraine |
nd |
nd |
12.7 |
10.4 |
nd |
– 2.3 |
Belarus |
nd |
nd |
4.5 |
7.1 |
nd |
2.7 |
Switzerland |
3.1 |
3.7 |
3.8 |
4.0 |
0.9 |
0.1 |
Americas |
83.9 |
101.0 |
143.1 |
183.8 |
99.8 |
40.6 |
- North America |
65.3 |
65.7 |
84.1 |
104.5 |
39.2 |
20.4 |
United States |
57.0 |
58.2 |
76.0 |
96.4 |
39.4 |
20.4 |
Mexico |
2.5 |
7.2 |
9.5 |
11.8 |
9.3 |
2.3 |
Canada |
8.3 |
7.4 |
8.2 |
8.2 |
-0.2 |
0.0 |
- Central America |
3.3 |
8.6 |
12.2 |
15.5 |
12.2 |
3.4 |
- South America |
14.4 |
24.8 |
45.1 |
61.6 |
47.3 |
16.5 |
Brazil |
5.3 |
12.1 |
20.6 |
33.9 |
28.6 |
13.3 |
Argentina |
4.2 |
5.3 |
10.1 |
10.3 |
6.1 |
0.2 |
Oceania |
11.5 |
12.3 |
23.1 |
30.7 |
19.2 |
7.6 |
New Zealand |
5.2 |
6.7 |
12.2 |
21.7 |
16.5 |
9.4 |
Australia |
6.3 |
5.6 |
10.8 |
9.0 |
2.7 |
– 1.8 |
Asia |
42.8 |
69.9 |
169.4 |
322.5 |
279.7 |
153.1 |
India |
20.4 |
31.6 |
79.9 |
165.3 |
145.0 |
85.5 |
Pakistan |
6.0 |
9.0 |
25.6 |
42.9 |
36.9 |
17.4 |
China |
1.8 |
2.9 |
12.0 |
34.8 |
32.9 |
22.8 |
Japan |
2.1 |
6.5 |
8.5 |
7.4 |
5.3 |
– 1.1 |
Africa |
11.0 |
17.1 |
30.6 |
48.0 |
37.0 |
17.4 |
Kenya |
0.7 |
1.2 |
2.7 |
5.3 |
4.6 |
2.6 |
Egypt |
1.2 |
1.9 |
3.8 |
5.1 |
3.9 |
1.3 |
Sudan |
nd |
nd |
nd |
4.4 |
nd |
nd |
Ethiopia |
nd |
nd |
1.1 |
3.5 |
nd |
2.4 |
Algeria |
0.3 |
0.8 |
1.9 |
3.3 |
3.0 |
1.4 |
Morocco |
0.4 |
0.8 |
1.3 |
2.6 |
2.2 |
1.3 |
World |
344.2 |
465.8 |
579.5 |
809.8 |
465.6 |
230.3 |
The US is the world's third largest milk producer (12% of the total), after India and the EU. Milk production, mostly from large capital-intensive farms (more than half of cows are located on farms with more than 1,000 cows), will continue to increase, mainly due to improved animal-production performances and the use of external inputs (USDA, 2017). As in other countries, this increase raises environmental issues. California is the leading dairy region in the US, producing 19% of the country’s milk and 33% of its exports (by volume). California is also well known for recurring droughts. As the world's third largest exporter of dairy products, the US has intense trade with Canada and Mexico through the North American Free Trade Agreement (NAFTA).
c. Oceania
Milk production in Oceania reached 30.7 Mt in 2016 (3.8% of the world total), almost three times as much as in 1961. Given Oceania’s relatively small population, this production far exceeds domestic demand. Thus, the percentage of self-sufficiency in milk in Oceania has reached nearly 290%. Production in Australia (9 Mt in 2016) decreased slightly after 2000, while that in New Zealand (21.7 Mt) is distinct mainly due to its strong presence on international markets (Institut de l'Élevage, 2018a). New Zealand farms, which are high-tech systems based on grazing and high labor productivity, are among the most efficient per unit cost of milk production. The current increase in production and intensification of agricultural practices (irrigation and fertilization) raise serious environmental issues (Foote et al., 2015) that could decrease the annual increase in production in the future. New Zealand exports 95% of its production, mainly to Asian countries and through a single cooperative company (Fonterra), which gives it a strong influence on international prices. Price volatility, which has increased since 2008, leads to strong fluctuations in export revenue and decreases farm profitability, especially since farms receive little public support (Gouin and Kroll, 2018).
d. Asia
Asian countries produced 322 Mt of milk in 2016 (39.8% of the world total). This region has experienced the largest change in production, which increased by 280 Mt since 1961, which represents 60% of global growth. However, domestic demand is not yet fully met, and Asia's self-sufficiency is 90%.
India plays a crucial role in this increase in production (Landes et al., 2017). Despite internal difficulties, including the low genetic potential of cattle and production fragmented into innumerable small family farms, milk production has increased by 145 Mt since 1961 (33% of global growth). According to the OECD-FAO (2018), India’s milk production is projected to increase by 75 Mt over the next decade. India is expected to produce nearly 25% of the world’s milk in 2027 but not to play a significant role on the world’s dairy imports and exports market.
China has little influence on global dairy production (ca. 4% in 2016). After a sustained increase from 2000-2010, milk production decreased (Chaumet, 2018). The development of milk production on a few modern "showcase farms", large and with little self-sufficiency in inputs, is counterbalanced by a strong restructuring of family smallholdings. China’s milk production has become more stable, but its costs are higher than those in the US or the EU. However, China can meet its domestic demand mainly due to an increase in imports (Institut de l'Élevage, 2018b), especially of different types of milk powder. Imports also meet the expectations of consumers who have become less confident in the quality of local products following the scandal of milk contaminated with melanin in 2008 (Pei et al., 2011). In 2027, milk production in China is projected to be lower than that in Pakistan, which has a strong dairy tradition (Zia et al., 2011).
e. Africa
According to FAOSTAT, African milk production in 2016 represented 6% of global milk production, for 16% of the global population. Africa’s self-sufficiency in dairy products decreased slightly from 88% in 2010 to 84% in 2017 (International Dairy Federation, 2018). Africa's milk production increased by 37 Mt from 1961-2016, which is 8% of global growth or the equivalent of countries such as Pakistan.
The influence of the livestock and dairy sectors on the domestic agricultural economy varies greatly among African countries. The top seven milk producers, representing nearly 60% of African milk production, are Kenya (5.3 Mt), Egypt (5.1 Mt), Sudan (4.4 Mt), South Africa (3.5 Mt), Ethiopia (3.5 Mt), Algeria (3.3 Mt), and Morocco (2.6 Mt). Milk is an important component of pastoral populations in Africa. Beyond its intrinsic economic value, it also has a strong social and cultural value. Targeted studies of Morocco (Sraïri, 2011), Ethiopia (Yilma et al., 2011), Kenya (Bingi and Tondel, 2015), Senegal (Corniaux et al., 2014; Seck et al., 2016), and Algeria (Makhlouf et al., 2015) provide better understanding of the diversity of the African dairy sector.
Although the OECD-FAO suggests that African milk production could increase by 30% in the next decade, these projections should be treated with caution. Any relatively rapid development of milk production will depend, in part, on the economic and trade policies adopted. Developing local production (as in Kenya) rather than resorting to imports from the international market is crucial. This raises questions about the optimal level of protection of the domestic market via tariffs and the role of foreign investors in the valuation of locally produced milk (Corniaux, 2015).
2. Key elements of the sustainability of the dairy sector in several geographic regions
This second section addresses three key elements of the sustainability of the dairy sector: the farmers’ work and gender implications, water resources, and the diversity of livestock species.
2.1. Labor and gender considerations necessary to develop of dairy farming
The work of livestock farmers is a major issue in countries of the Southern Hemisphere (Cournut et al., 2018).
How livestock farmers organize and perform their work influences their
ability to secure their livelihoods and meet the increased demand for
agricultural products. Work organization is an advantage in response to
markets due to its resilience and flexibility, but is a limitation when
labor resources are few or tasks are arduous (Novo et al., 2012).
Although the organization of work on dairy farms depends on production
and marketing systems in specific contexts and individual
farm-management choices, common gender-related behaviors exist. Even
though women are highly involved in dairy production and contribute to
food security, nutrition, and natural resource management, gender
inequalities remain widespread and persistent. Women and girls encounter
significant restrictions that limit their access to resources and
services, as well as their ability to obtain new jobs or entrepreneurial
opportunities in the dairy sector that would allow them to engage in
more profitable activities. In most cases, men perform and control the
activities that generate the most value. Women engaged in this sector
are restricted to activities at the lower end of the value chain
a. Variability in working hours
Workloads on dairy farms are often high, which can limit their ability to change (Cournut et al., 2018). The opportunities for change vary, however, as indicated by the differing number of working hours per dairy farm among countries (e.g. from a mean of 1910 hours per year in Morocco to 3780 hours per year in Vietnam) and within a given production zone (960-3640 hours per year in Morocco) (Santos Filho et al., 2012; Sraïri et al., 2013). Working hours vary due to a combination of factors: available labor, task allocation, technical and mechanization choices (mechanical milking vs. manual milking), herd management (grazing vs. feed distribution), the possibility or not to increase daily working hours, delegation of tasks to employees, sharing, or contractual assistance. (Hostiou et al., 2015). The several interactions between these factors make work organization a complex process in which individual choices prevail; thus, each farm is a particular case. These choices are related to each farmer's vision and access to available resources. To manage the workload, a farmer may request family volunteers, while another might increase personal daily working hours (Cournut et al., 2018).
b. Often difficult working conditions
Working conditions on dairy farms in the Southern Hemisphere are often harsh. Milking is time-consuming (50% of daily working hours) and includes repetitive tasks. In some countries, other tasks are important, such as feeding, grazing, and cutting. For example, on mixed milk/meat farms in Morocco, feeding requires the most time because most fodder is grown on small plots and requires long-distance transport (Sraïri et al., 2013). Because equipment is often modest (e.g. manual milking on 40% of Brazilian dairy farms) (de Oliveira et al., 2018), most work is manual. Technical advances can reduce the workload and increase milk production. For example, cutting sugarcane instead of maize silage reduces the time spent feeding cows (Hostiou et al., 2015). While this change does not involve much investment, it does require a certain amount of equipment and know-how to ensure the quality of animal feed. In this respect, access to support services is essential to disseminate information and knowledge and to promote the adoption of technologies and best practices.
c. A workforce that is often family-based
Family members perform most of the work on dairy farms (Wiggins et al., 2010). When family labor is limited, livestock farmers must change the production system and simplify herd management or hire employees, at least when financial resources allow. According to the gender division of labor, women tend to be more involved in small-scale, intensified operations in addition to domestic and family-care work (Kathothya, 2017). In Africa, women spend 15-22% of their time on unpaid domestic work, 5-7 times as much than men (World Bank, 2006). In Latin America, women spend more than 33% of their time on domestic and family-care work, while men spend 10% (Rico, 2017). Women have high workloads, which has a large impact on their contribution to milk production (Kayotha, 2017). They perform tasks on the farm such as milking, daily care of the animals, and housekeeping. Unlike women, men have no mobility restrictions and perform tasks outside the farm and community, including growing fodder, transporting milk to collection centers, and selling milk. Men are more likely to work in the field and in the community.
d. Reduced access to resources for women
Managing livestock is positively correlated with a decrease in poverty (FAO and African Union, 2018) and can be performed by both men and women. However, a recent study on job creation in the small-ruminant livestock sector in Ethiopia showed that although co-ownership, usually between spouses, was the most common form of animal ownership, men often made the final decisions, particularly for marketing (Mueller et al., 2017). In addition, women often have limited access to and control over productive livestock resources; for example, they own 13-25% of the livestock in Zimbabwe, Botswana, Namibia, Niger, and Gambia. Women have less access to the resources and services that would put them on equal footing with male entrepreneurs, with whom they often compete for resources and training (FAO, 2018a). As a result, women in rural areas are easily trapped in a vicious cycle of poverty and food insecurity, which challenges their ability to improve their livelihoods. Lack of recognition of their contributions, social norms, and educational and financial barriers often relegate them to small-scale commercial activities, and are obstacles to changing the scale of their activity. In some developing countries, available knowledge is lacking on how the variety of stakeholders function and benefit from milk production. In-depth studies are required to better understand how social factors shape functioning of the value chain and to better identify gender issues (Box 1).
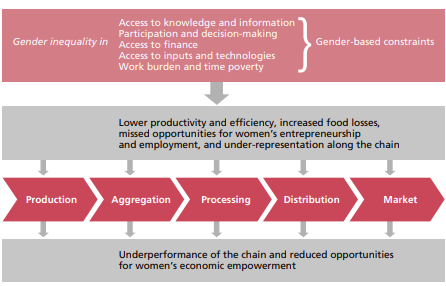
Box 1. The FAO conceptual framework to increase consideration of gender issues.
To enable policy makers and stakeholders to increase consideration of gender issues, the FAO created a conceptual framework that includes key concepts for developing a gender-sensitive value chain (FAO, 2017b) and published a corresponding practical guide (FAO, 2018b). This framework specifies how gender inequalities affect the performance and sustainability of the value chain (figure 4). It identifies sources of these inequalities so that interventions can benefit both women and men. This framework considers social, cultural, economic, and political factors. The individual is placed at the center of the analysis by considering the diversity of male and female stakeholders in the value chain. It emphasizes the importance of the farm household and the power relations that occur. Adding these two dimensions - the individual and the household - to value-chain analysis is essential to strengthen social sustainability and address gender inequalities. The latter limits women's equal access to production resources (capital, agricultural, and financial services) and decreases their self-confidence and decision-making ability. These factors influence the distribution of workloads and profits, which influences the efficiency and degree of inclusion in the value chain.
Figure 4. Gender limitations and value-chain performance (FAO, 2018b).
2.2. Sustainable use of water resources and the dairy sector
Since the 1950s, the increase in global agricultural production has been based in part on increased use of water and the subsequent development of irrigation (Tilman et al., 2002). These trends may not be sustainable due to the progressive depletion of groundwater. Thus, many studies agree on the need to base future agricultural development on prioritizing the use of rainwater (Falkenmark, 2007). This recommendation also applies to the development of cattle production, which uses large volumes of water (Hoekstra, 2012; Corson and Doreau, 2013). In arid and semi-arid areas, where rainfall is highly seasonal, water restrictions are a decisive limiting factor for dairy farming (Armstrong, 2004). This phenomenon is expected to become even more pronounced in the coming decades due to climate change. Within this context, this section studies the relation between dairy farming and water resources in Morocco and India, two contrasted developing countries with many small farms (figure 5).
Figure 5. Water use in dairy farming in Morocco and India.
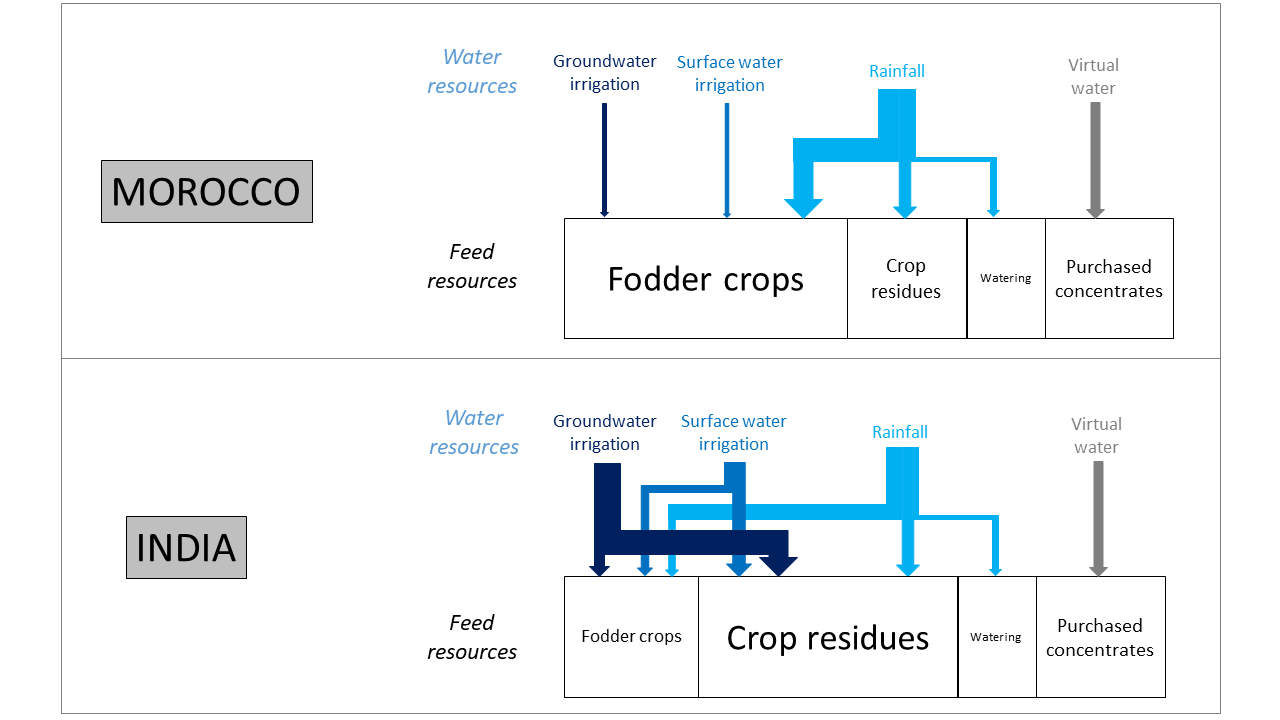
In Morocco, more than 80% of the country's farms have less than 5 ha of land (Sraïri, 2011). The study quantified the water consumptions (rainfall, irrigation with surface water or groundwater). It also estimated inputs of "virtual water" (i.e. used to produce the purchased feed - especially concentrates-) for each farm’s subsystems (milk and meat). The study was performed over an entire agricultural year on five farms (mostly small and mixed crop/livestock farms) representing the diversity of situations encountered in a region that receives 560 mm of rainfall per year (from November-April). On each farm, the study assessed: i) the volumes of water used to produce fodder; ii) the rations, which combined farm-grown fodder and purchased feed; and iii) the volumes of milk and meat produced. The study also assessed the profitability of the milk and meat subsystems.
Results indicated that in this semi-arid climate, cattle farming first uses rainwater, which met 53% and 48% of the water requirements for milk and meat production, respectively (table 2). In comparison, use of “virtual water” was lower for milk production (26%) but quite similar for meat production (45%). This result reflects that the cattle obtain most of their energy from crop residues and fodder crops, which are either completely rainfed (oat and wheat straw) or partially irrigated (berseem clover), and whose vegetative cycle coincides with the rainy season. Low forage yields result in purchases of large amounts of concentrates, increasing virtual water use. The results also show that cattle production uses little local groundwater (13% and 2% of the water requirements for milk and meat production, respectively). The average water footprints (i.e. the sum of water consumption from all sources) were 1.6 m3 per L of milk and 8.4 m3 per kg liveweight (ca. 15.3 m3 per kg carcass), which is slightly higher than international reference values. The gross margin per m3 of irrigation water, considered as the economic optimization of this resource, was estimated at €0.12 and €1.26 per m3 for milk and meat production, respectively.
Table 2. Estimates of different types of water use on five cattle farms in Morocco, and economic optimization of irrigation water (Source: Authors' calculations (M.T. Sraïri)).
Indicator |
Farm |
Mean |
||||
|---|---|---|---|---|---|---|
1 |
2 |
3 |
4 |
5 |
||
Total water used per kg of milk (m3) |
1.26 |
1.30 |
1.59 |
1.26 |
3.13 |
1.62 |
- of which % rainwater |
46 |
22 |
44 |
59 |
88 |
53 |
- of which % virtual water |
8 |
69 |
28 |
26 |
6 |
26 |
- of which % groundwater |
0 |
0 |
28 |
14 |
6 |
13 |
- of which % irrigation water |
46 |
9 |
0 |
0 |
0 |
7 |
Economic optimization of irrigation water via milk production (€/m3) |
0.12 |
-0.10 |
0.16 |
0.57 |
0.00 |
0.12 |
Total water used per kg of meat in liveweight (m3) |
7.17 |
7.15 |
8.18 |
9.80 |
7.76 |
8.44 |
- of which % rainwater |
0 |
12 |
54 |
75 |
23 |
48 |
- of which % virtual water |
100 |
57 |
45 |
20 |
75 |
45 |
- of which % groundwater |
0 |
0 |
1 |
5 |
2 |
2 |
- of which % irrigation water |
0 |
31 |
0 |
0 |
0 |
4 |
Economic optimization of irrigation water via cattle liveweight gain (€/m3) |
- |
0.35 |
5.78 |
1.52 |
1.58 |
1.26 |
These results also highlight the advantage of combining crop and livestock farming from a water-use perspective, given the latter’s efficient use of rainwater and contribution to the maintenance of soil fertility through manure spreading. The results also strengthen the idea that livestock farming can help establish sustainable farming systems as long as it does not increase groundwater withdrawals. In many parts of Morocco, however, groundwater is overexploited for watering crops for market gardening and orchards, whose water requirements peak is in summer. These crop-production systems experience in addition more volatile prices than milk and meat, increasing economic risks for farms (Ameur et al., 2017).
A second study (Aubron et al., 2017) assessed the relation between water and dairy farming in India. India withdraws the largest amount of groundwater in the world (Aeschbach-Hertig and Gleeson, 2012). Irrigation, combined with high-yielding varieties and the increasing use of synthetic fertilizers as part of the "Green Revolution", has considerably increased the quantities of cereals produced in the subcontinent since the 1970s. Borewells drilling continues at a rapid pace, despite signs of resource depletion in certain areas (Shah, 2009). India is also known for its "White Revolution", which have combined the development of a vast cooperative network for milk collection, processing, and distribution with technical changes in genetics and animal nutrition, and has thus helped to make the country the world's leading producer.
Although using different methods, the Green and the White Revolutions had the same objective of building national self-sufficiency in cereals and dairy products (Aubron et al., 2017). The White Revolution also aimed at providing an alternative way to increase land productivity in areas that remained aloof from the Green Revolution. Statistical data show that except for certain areas, there is a significant overlap between irrigated areas - 40% of them irrigated with groundwater - and areas with high milk production, particularly in northern India. This is due to the large use of rice and wheat residues for feeding animals, which are two major irrigated crops of the Green Revolution. Although grown less often, fodder crops are almost always irrigate, and thus contribute to this overlap. Regarding the households involved in the White Revolution, National statistical data and field studies carried out by the India Milk project point to the fact that they have limited access to land and water compared to households involved in the Green Revolution. However, access water for irrigation increases fodder and dairy production in small family farms. With or without irrigation, dairy farming plays a major role in the economy of the many households involved.
Several studies have analyzed water consumption of Indian dairy farms. According to Amarasinghe et al. (2012), water consumption for production of fodder and concentrates, as well as for livestock watering, is similar to that for production of sugarcane and wheat at national level, and represents 10-12% of total agricultural consumption. Depending on the methods and regions considered, the economic valuation of water in dairy farming equals €0.01-0.31/m3 (Clement et al., 2010), €0.08/m3 (Singh et al., 2004), and €0.44/m3 (Amarasinghe et al., 2012), the last two studies observing lower profitability than irrigated market gardening. Caumartin (2017) studied three contrasting Indian dairy systems in irrigated areas and found that fossil-energy consumption for pumping water only for fodder represented 7-18% of the total fossil energy consumption. In this study, which considered four dairy systems in total, fossil-energy consumption per liter of milk was higher than literature values. The low efficiency of water and fossil-energy consumption in Indian dairy farming is due in part to the low milk yield of cows and buffaloes (< 2500 liter per year). However, it is also related to the generally low efficiency of Indian agriculture for these criteria due to price and subsidies conditions, which give little incentive to save these resources, and also likely because India's energy use is still based on coal.
Nitrogen balances of cropping systems in a village of the state of Gujarat highlight the impact of dairy farming on water quality (Aubron et al., 2019). This area has a high livestock density and has long been involved in the White Revolution. Nearly all cropping systems nitrogen balances are strongly positive (e.g. up to 1100 kg/ha of surplus nitrogen in tobacco-based cropping systems), which is consistent with the high nitrate concentrations in drinking water (the potability limit was exceeded in 11 of the 16 samples taken). However, the contribution of livestock manure (i.e. < 25% of nitrogen inputs) is lower than that of synthetic nitrogen fertilizers. This suggests that managing manure differently could decrease the use of synthetic fertilizers. Livestock farming would then become less a problem for water quality than a potential solution for improving it by strengthening the crop-livestock relations (e.g. feeding crop residues to livestock).
In the two case studies presented, the relation between cattle production and water seems to structure sustainable agrarian systems. In Morocco, in semi-arid areas where supplemental irrigation is available, cattle production relies mainly on rainwater, while in India it adds value to the co-products of irrigated crops, mainly rice and wheat straw. Moreover, it appears that for many households with little land or irrigation water, livestock farming is a way to generate stable and sustainable income by restoring soil fertility (returning manure to crop plots) and optimizing use of the available labor force (Sraïri and Ghabiyel, 2017).
2.3. Milk diversity: the role of non-cow milk in development of the global dairy sector
Cows dominate the approximately 10 species that humans have domesticated to meet the need for milk. According to FAO statistics for 2017, cow milk represents 81% of the milk produced worldwide, followed by buffalo (14.9%), goat (2.3%), sheep (1.3%), and camel (0.4%); the remainder is produced by species such as the horse (Doreau, 1991), donkey, yak, reindeer, and llama (Morin et al., 1995). In total, non-cow dairy species produce 152 Mt of milk. These species are useful mainly because of their influence on product diversity, food security, and regional development in the most marginal regions of the planet, and less due to the volume of milk produced, especially since, except of small ruminants, they depend on specific ecosystems in developing countries.
a. Contribution of non-cow milk to food security
Although relatively small, the percentage of milk from non-cow species in global milk production (19%) has more than doubled in almost 60 years (Faye and Konuspayeva, 2012; Faye, 2016a). Since the increase in production has exceeded human population growth, mean per capita consumption increased from 10 L per year in 1961 to nearly 20 L in 2017. While consumption of this milk remains rare in Western countries and Latin America, it has reached 34% in Asia and 26% in Africa. It even exceeds 50% in parts of West Africa and South Asia. A large percentage of this milk (23% on average) is consumed in the poorest countries (annual per capita gross domestic product (GDP) < US$1000); however, there is no correlation between GDP growth and the percentage of non-cow milk consumed (Faye, 2016a).
Qualitatively, these types of milk are not simple substitutes for cow milk. They are a food resource and a source of income for populations living in specific and mostly disadvantaged ecosystems, being produced by dairy camels in deserts (Wernery, 2006), yaks in highlands (Dong et al., 1999), buffaloes in wetlands (Bilal et al., 2006), horses on steppes (Konuspayeva and Faye, 2011), reindeer in polar regions (Holand et al., 2002), and goats and sheep in areas that are often semi-arid or have steep slopes (Boyazoglu and Morand-Fehr, 2001). They are produced in areas in which cattle farming is difficult. Even though dairy farms with thousands of Holstein cows have been set up in deserts (e.g. Saudi Arabia), their ecological sustainability (compared to that of dairy camel farms) is questionable (Faye, 2016b). Non-cow milk is often produced in farming systems that have low external inputs. They are typically used for self-consumption in the poorest households. This is the case for the goat, which has earned its nickname as the "poor man's cow". In general, rearing non-cow species requires less investment than rearing cattle and usually involves local breeds that are well adapted to their environment.
Moreover, consuming non-cow milk is a cultural habit and is therefore a part of the identity of specific populations. This includes koumiss (fermented horse milk) for Central Asians, yak butter for Tibetans, and camel milk for Bedouins. These types of milk have specific compositions (e.g. types of caseins and serum proteins, fatty acids, oligosaccharides, vitamins, trace elements) and properties. For example, buffalo milk is rich in calcium and protein, which is valued in cheese making, and is part of the success of products such as mozzarella (Gaucheron, 2011). Camel milk is rich in vitamin C and does not contain β-lactoglobulin, which is responsible for allergies to cow milk (Al Haj and Al Kanhal, 2010). Horse milk is rich in lactose and polyunsaturated fatty acids, which is similar to human milk (Malacarne et al., 2002). The diversity of these fine differences in composition also explain the specific technological characteristics that allow for an extraordinary variety of derived products. For example, yak, horse, and camel milk are used to produce more than 500 dairy products in Mongolia (Dugdill and Tsetsgee, 2006).
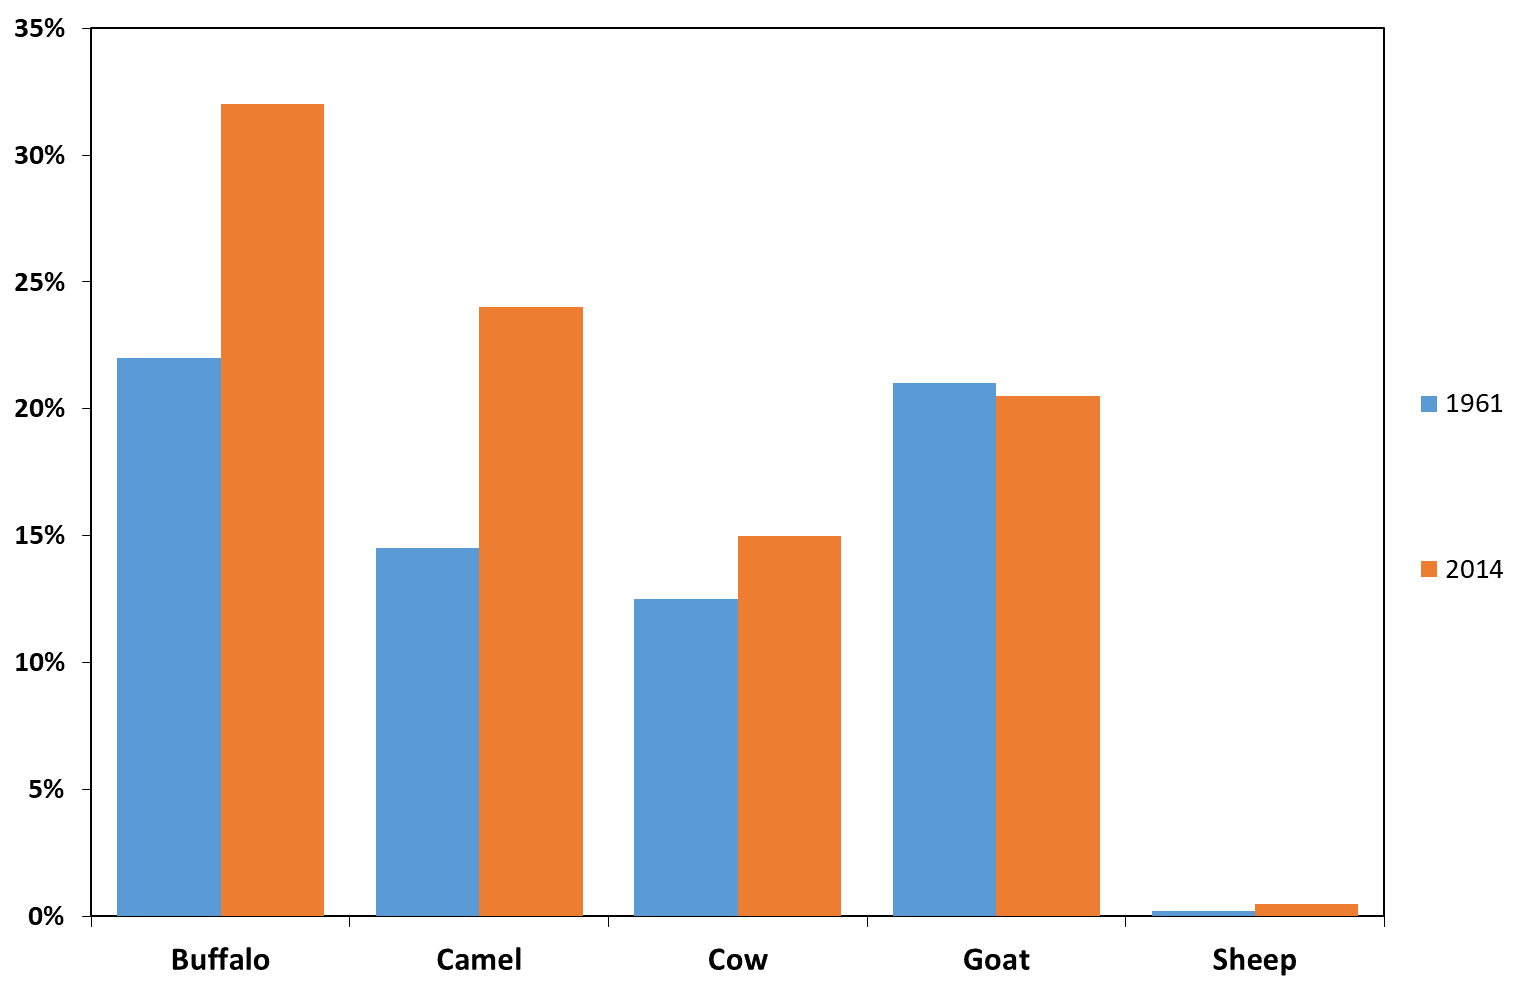
The percentage of dairy females is a useful indicator of the main use of a livestock species (milk or meat). Except for sheep, non-cow species have a higher percentage of dairy females than cows, and the percentage has increased considerably since 1961, except for goats (figure 6).
Figure 6. Percentage of dairy females of livestock species in 1961 and 2014 (Source: FAO).
b. Non-cow milk is often produced in small-scale systems to ensure sustainable milk production in highly constrained ecosystems.
The systems that produce non-cow milk are usually small and extensive, in which self-consumption is substantial and on-farm processing predominates. However, the variety of farming systems is wide, from traditional high-mobility, low-input systems to sedentary, intensive systems. For example, camels are reared in both traditional "Bedouin" systems (i.e. no supplemental feed, mobile herds, and low market integration) and on large commercial farms that raise them like high-potential cows, with feeding of concentrates, mechanical milking, and permanent housing (Faye et al., 2017).
Since non-cow species are often found in areas with low productivity or strong health and environmental constraints (e.g. arid, polar, mountain, or marshy zones), rearing them for milk production contributes to the development of developing regions. They also highlight the universality of human consumption of milk and the diversity of species involved. For example, buffalo, yaks, and camels are known to value low-quality fodder, as are reindeer, which can feed on lichens. Moreover, most livestock subsystems in these areas have multiple species and thus less impact on the environment because the feeding behavior of one species complements those of the others (e.g. sheep and camels; Rutagwenda et al., 1990).
Women often rear small species such as goats and sheep, which provides income, especially since on-farm processing predominates. This applies to almost all non-cow species, since the volumes produced are small and of little interest to outside investors and dairies. This encourages farmers to add value to their products via on-farm processing and to provide markets with local, traditional products that have little or no competition from international markets. There is no international market for horse milk or camel milk powder that could interfere with local production, although websites have begun to market camel milk powder. Overall, non-cow milk remains a small part of the international market, although exceptions exist. For example, large amounts of mozzarella cheese made from buffalo milk in Italy is exported to other EU member states (Borghese, 2004). There is also a significant export potential for some "exotic" dairy products such as camel milk, which is known for its dietary and "medicinal" virtues, or horse milk for the cosmetics sector (Konuspayeva and Faye, 2011; Nagy et al., 2014).
However, these value chains based on non-cow milk are faced with the low productivity of the species concerned and the need to respond better to the demand of larger markets (the milk is rarely sold beyond the local scale). Successful development of these sectors requires improving hygiene, implementing real collection networks, establishing specialized dairies (Abeiderrahmane, 1997), and identifying new products that correspond to the tastes of urban consumers (Konuspayeva et al., 2017).
Because of their organoleptic and technological qualities, these types of milk increase humanity’s food diversity greatly. Although small, the volumes produced add value to specific ecosystems that are often on the margins of development. Therefore, they should be assessed for their role in the food security of the most vulnerable populations. Their relevance goes beyond food security, however; they clearly contribute to sustainable regional development, in case of promoting livestock farming in marginal areas. Some of the dairy products derived from these species demonstrate clear added value.
3. Trade: a way to meet a temporary or structural deficit in dairy products
Given the production limitations of the dairy sector (e.g. labor, water, resource requirements for fodder) previously described and/or the sustained increase in domestic demand, some countries are unable to meet their domestic demand for dairy products. Purchasing dairy products from regional or international markets is one of the best ways to meet that demand. The higher the cost of producing milk locally compared to the price of imported milk, the greater the temptation to resort to imports. For strategic reasons (e.g. job preservation, land maintenance, food self-sufficiency), some countries may nonetheless limit imports by encouraging domestic production through multiple measures (e.g. investment aid, development of local industries). The global market for dairy products is the result of these trade-offs and the trade rules agreed upon, either bilaterally between two partner countries or multilaterally within the World Trade Organization.
Without underestimating the importance of international trade in dairy products (71 Mt of milk equivalent in 2017, excluding intra-EU trade, i.e. 8% of world production), most countries consume milk produced locally according to production models that vary greatly among countries. This holds true in many developing countries, especially those that have little economic ability to use imports, and non-coastal countries whose imports require long-distance land transportation. In contrast, developed countries import smaller amounts of dairy products due to their high production potential compared to the size of the local population (e.g. New Zealand). Similarly, and given the perishable nature of fresh dairy products, these exchanges are organized mainly between neighboring countries, such as in the EU and NAFTA.
The percentage of dairy products traded internationally varies greatly among products. For liquid milk and a wide variety of fresh dairy products, trade is historically extremely low (often less than 2% of production). According to the OCDE-FAO (2018), in 2027 this percentage is projected to reach 8% for butter, 11% for cheese, 42% for whole milk powder, and 55% for skimmed milk powder. In general, international trade involves mainly certain cheeses and types of milk powder (e.g. infant milk, skimmed milk, whole milk, whey).
Depending on the objective of the analysis, trade in dairy products is expressed in tonnage, economic value, or milk equivalents. Since developing countries tend to buy less expensive dairy products (especially cheese) than developed countries, their contribution to international trade is higher when trade is expressed in milk equivalents rather than value. In the dairy sector, most trade involves standardized products that are increasingly processed on a large scale by international companies. More rarely, specific products that emerge from the diversity of local expertise are traded.
Among continents, Asia is the leading importer of dairy products, accounting for 42.3 Mt of milk equivalent in 2017, or 59% of international trade. The main importing countries in Asia are China (13.3 Mt, 19% of the world total), Indonesia (2.7 Mt), Malaysia (2.2 Mt), Japan (2.2 Mt), and the Philippines (2.1 Mt). Asia's exports of dairy products (6.2 Mt), one-seventh the size of its imports, are mainly destined for Saudi Arabia, Iran, and Turkey. Asian countries, especially China, are the main source of the growth in international trade in dairy products. In current currency, Chinese imports, which amount to 8.5 billion euros in 2016, have increased almost eightfold in current currency since 2000. In contrast, India, the world’s largest milk producer, plays a minor role in international imports or exports of dairy products.
Africa is the second largest importer of dairy products (in milk equivalents), far behind Asia. The 9.8 Mt imported into Africa in 2017 (14% of the world total) went mainly to Algeria (3.6 Mt) and Egypt (1.0 Mt). Products imported into Africa can strongly influence development of local supply chains. In coastal countries, many multinational companies are located near ports. The trade policy adopted by a given country (e.g. tariffs on imported products), can promote or, conversely, hinder development of local industries. In general, it is crucial to develop local milk production when possible, rather than to resort to imports from the international market. African countries export few dairy products on the international market (1.2 Mt, one-fifteenth the exports of New Zealand). With a trade balance for dairy products of €-1.03 billion in 2016, Algeria has the fifth largest deficit (by value), after China, Russia, Japan, and Mexico (table 3).
Table 3. The main zones/countries involved in the international trade of dairy products (in current billions of €) (Source: BACI / Analysis: INRA SMART- LERECO).
Exports |
Imports |
Trade balance |
|||||||
|---|---|---|---|---|---|---|---|---|---|
2000-09 |
2010-15 |
2016 |
2000-09 |
2010-15 |
2016 |
2000-09 |
2010-15 |
2016 |
|
The 10 zones/countries with the largest dairy-product surplus (in descending order of 2016 trade balance) |
|||||||||
EU-28 |
7.44 |
13.27 |
15.60 |
1.24 |
1.48 |
1.28 |
6.21 |
11.79 |
14.32 |
New Zealand |
3.68 |
8.35 |
8.40 |
0.06 |
0.21 |
0.23 |
3.62 |
8.14 |
8.18 |
Switzerland |
0.57 |
1.27 |
2.22 |
0.32 |
0.51 |
0.56 |
0.25 |
0.77 |
1.66 |
Belarus |
0.44 |
1.50 |
1.68 |
0.04 |
0.08 |
0.10 |
0.40 |
1.42 |
1.59 |
Australia |
1.59 |
1.85 |
1.94 |
0.30 |
0.66 |
1.00 |
1.28 |
1.19 |
0.94 |
Thailand |
0.22 |
0.71 |
1.38 |
0.36 |
0.63 |
0.54 |
– 0.14 |
0.08 |
0.84 |
Argentina |
0.49 |
1.13 |
0.74 |
0.03 |
0.04 |
0.04 |
0.46 |
1.08 |
0.70 |
United States |
1.60 |
4.35 |
4.47 |
1.81 |
2.44 |
3.84 |
– 0.21 |
1.91 |
0.63 |
Uruguay |
0.19 |
0.52 |
0.51 |
0.01 |
0.03 |
0.03 |
0.19 |
0.49 |
0.48 |
Lithuania |
0.24 |
0.50 |
0.42 |
0.07 |
0.24 |
0.21 |
0.16 |
0.27 |
0.20 |
The 10 countries with the largest dairy-product deficits (in ascending order of 2016 trade balance) |
|||||||||
China |
0.24 |
0.42 |
0.76 |
1.10 |
5.63 |
8.56 |
– 0.86 |
– 5.20 |
– 7.79 |
Russia |
0.21 |
0.30 |
0.30 |
1.17 |
3.00 |
2.19 |
– 0.96 |
– 2.70 |
– 1.89 |
Japan |
0.05 |
0.14 |
0.16 |
1.04 |
1.49 |
1.47 |
– 0.99 |
– 1.36 |
– 1.31 |
Mexico |
0.20 |
0.39 |
0.49 |
0.96 |
1.47 |
1.66 |
– 0.76 |
– 1.09 |
– 1.17 |
Vietnam |
0.08 |
0.08 |
0.06 |
0.26 |
0.70 |
1.17 |
– 0.18 |
– 0.61 |
– 1.11 |
Algeria |
0.01 |
0.02 |
0.00 |
0.62 |
1.15 |
1.04 |
– 0.61 |
– 1.14 |
– 1.03 |
Canada |
0.24 |
0.24 |
0.24 |
0.54 |
0.86 |
1.15 |
– 0.30 |
– 0.62 |
– 0.91 |
Indonesia |
0.09 |
0.09 |
0.09 |
0.46 |
0.99 |
0.89 |
– 0.38 |
– 0.90 |
– 0.80 |
Philippines |
0.08 |
0.18 |
0.21 |
0.52 |
0.79 |
0.96 |
– 0.44 |
– 0.60 |
– 0.75 |
Saudi Arabia |
0.36 |
0.71 |
1.07 |
0.98 |
1.67 |
1.52 |
– 0.63 |
– 0.96 |
– 0.45 |
The other three continents (Europe, America, and Oceania) combined provide only 27% of global milk imports (by volume). The main importers are Russia (4.1 Mt), Mexico (3.9 Mt), the US (2.0 Mt), the EU (1.2 Mt), and Brazil (1.2 Mt). These three continents produce 90% of the world exports of dairy products. Expressed in economic terms, the top three exporters in 2016 were the EU (€15.6 billion), New Zealand (€8.4 billion), and the US (€4.5 billion), followed by Switzerland, Australia, and Belarus.
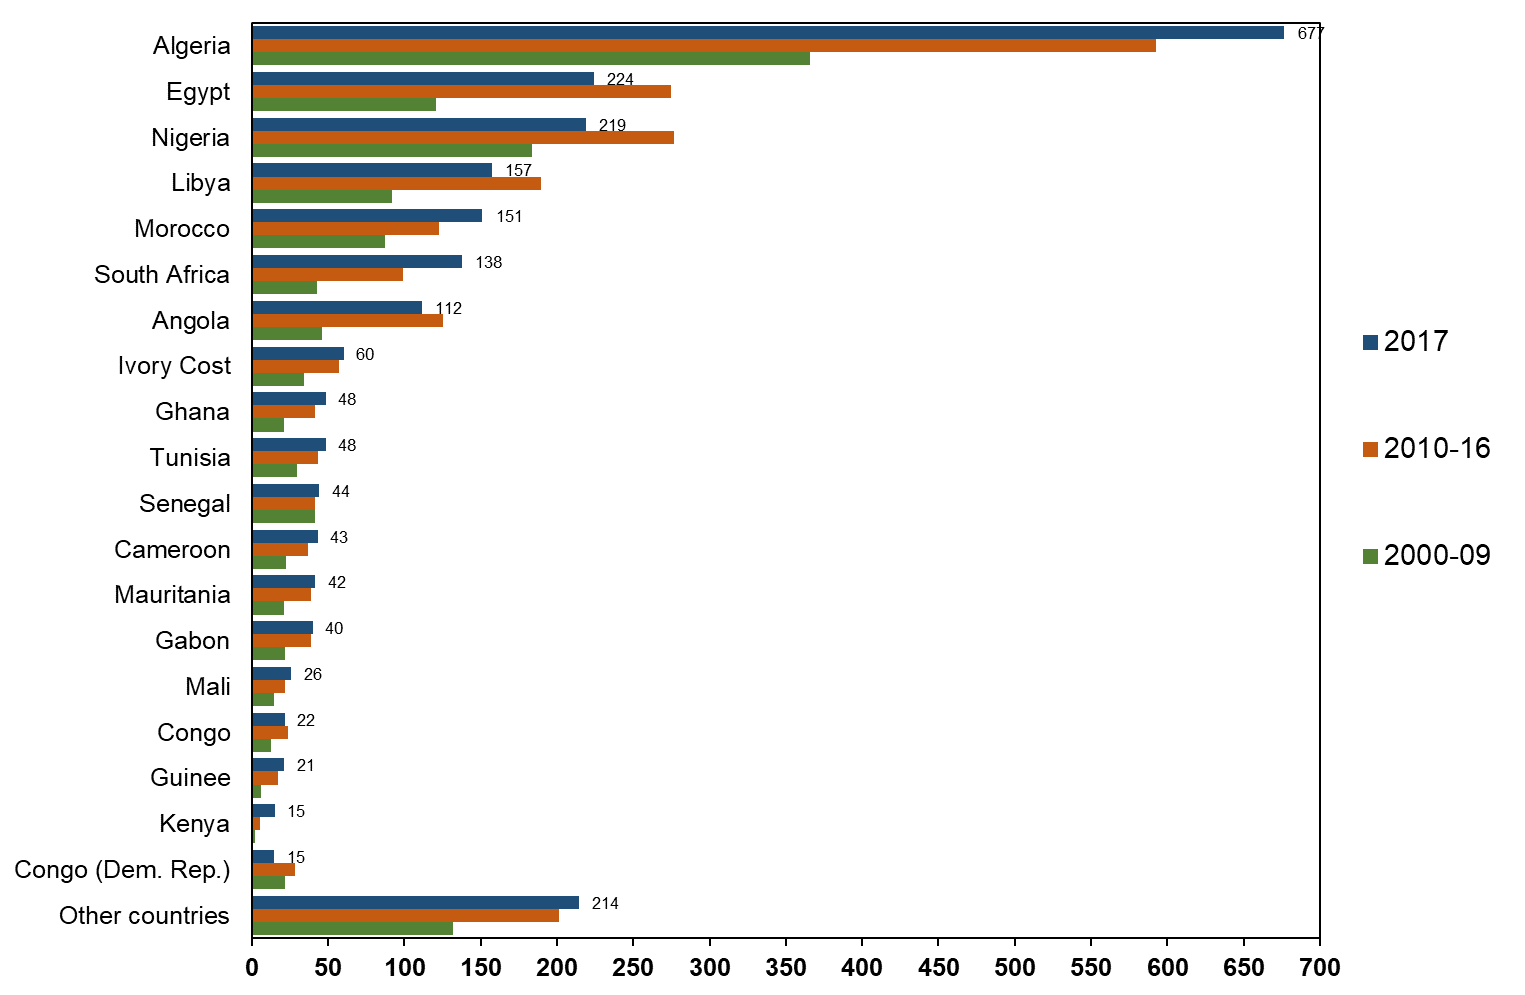
For the main dairy exporting countries exporting to a country with a deficit of milk production becomes more interesting if the country imports large amounts (as China), is sufficiently solvent, regulates its trade (e.g. importer approval procedure), and is easy to access geographically (preferably by sea). Thus, by economic value in 2016, China accounted for 26%, 25%, and 9% of exports from the EU, New Zealand, and the US, respectively. Compared to this, Africa is less important: 15%, 12%, and 1% of exports from the EU, New Zealand, and the US, respectively. For the EU, the leading exporting zone in terms of value (excluding intra-EU trade), Africa accounts for 34% of its skimmed milk powder exports, 28% in liquid milk, 22% in fat powder, 15% in butter, 10% in cheese, 8% in casein, 6% in cream and 5% in whey. The EU's main African customer is Algeria, followed by Egypt, Nigeria, Libya, and Morocco (figure 7). Without a rapid increase in domestic milk production in Africa, the projected increase in its population over the next few decades could cause these exports to increase.
Figure 7. European Union exports of dairy products to African countries from 2000-2017 (in current millions of €). (Source: COMEXT / Analysis: INRA SMART-LERECO).
Conclusion
Despite the current restructuring of the dairy sector, especially in industrialized countries (e.g. increasing farm size, geographic concentration of production, increasing importance of a few breeds), and globalization of markets, the diversity of the dairy sector remains extraordinary at the global scale. Each country has its own technical and production characteristics and a unique relation with the dairy economy. No universal model of dairy development exists.
Dairy production has a strong influence on the development of agricultural land and food security in many parts of the world, especially in developing countries, where investment is limited and modern technology is often lacking. It supports the employment of many people, especially women, who do not receive sufficient training, access to credit, or technical support from public authorities. In industrialized countries, technological progress (e.g. milking robots, automation), which requires substantial investment, results in rapid gains in productivity and a substantial decrease in labor requirements (for a given production volume).
By nature, dairy production uses large amounts of water (most of which should come from rainwater rather than groundwater) and fodder. Thus, in many developing countries where water resources are limited, an increase in milk production cannot meet all domestic demand, especially when the country’s population is also increasing. Competition between milk production and other types of agricultural production (e.g. market gardening, orchards) is sometimes extremely strong locally, especially when water is a strategic issue. At the global scale, water management in dairy systems must be optimized, not only by supplying locally produced feed, but also by considering the quantities of water imported in the feed purchased from further away, including other countries (e.g. Brazilian soybean imported by EU farmers; US alfalfa hay purchased by Chinese farmers).
While cows produce most milk in many developed countries, the situation is less obvious in many developing countries, where certain non-cow species can occupy a strategic position. Not only do non-cow species support economic development in disadvantaged ecosystems, they are promising avenues for sustainability, and deserve more attention in research and support, especially since their milk often has notable nutritional characteristics.
Focusing on the dairy sector, particularly in developing countries, this review partially addressed certain dimensions of the broad issue of sustainability. Many other studies address this issue, which has become as complex as it is essential. At the global scale, the dairy sector can contribute to the progressive achievement of FAO's five strategic objectives: contribute to the eradication of hunger, food insecurity and malnutrition; make agriculture more productive and sustainable; reduce rural poverty; promote open and efficient food and agricultural systems; and improve the resilience of livelihoods in the face of threats or crises.
Acknowledgements
We thank all the people will that made possible the international meeting "Milk, a Vector for Development" held in Rabat in May 2017, which inspired this article. Special thanks go to Agreenium for its support and announcements about the meeting; INRA (MICA Division and GloFoodS Metaprogram) and CIRAD for their financial support; the many partners and sponsors, especially the Fédération Interprofessionnelle Marocaine du Lait (FIMALAIT). Many thanks to Nathalie Le Marre, Laurine Piquemal, Sylvaine Bitteur, Rachel Boutrou, Philippe Parodi and all the crucial members of the administrative staff.
Notes
- The authors of this article have co-organized and participated in an international meetings called "Milk, a Vector for Development". After the first meeting in Rennes (France) in May 2014, subsequent meetings were held in Rabat (Morocco) in May 2017 and Dakar (Senegal) in June 2019. The presentations from the three meetings are freely available on the “Milk for development” (website: https://colloque.inrae.fr/lait2019). The next meeting is scheduled for Tunisia in 2021.
- The OECD was created in 1960, when 18 European countries, the US, and Canada joined forces to found an organization dedicated to economic development. Today, the OECD has 36 member countries around the world, from North and South America to Europe, Asia, and Oceania. Many of these countries are among the most advanced, but also include emerging countries such as Mexico, Chile, and Turkey.
- According to the FAO (2015), a sustainable food value chain is “the full range of farms and firms and their successive coordinated value-adding activities that produce particular raw agricultural materials and transform them into particular food products that are sold to final consumers and disposed of after use, in a manner that is profitable throughout, has broad-based benefits for society, and does not permanently deplete natural resources”.
References
- Abeiderrahmane N., 1997. Camel milk and modern industry. J. Camel Pact. Res., 4, 223-228.
- Aeschbach-Hertig V., Gleeson T., 2012. Regional strategies for the accelerating global problem of groundwater depletion. Nat. Geosc., 5, 853-861.
- Al Haj O.A., Al Kanhal H.A., 2010. Compositional, technological and nutritional aspects of dromedary camel milk. Int. Dairy J., 20, 811-821.
- Amarasinghe U.A., Shah T., Smakhtin V., 2012. Water–milk nexus in India: a path to a sustainable water future? Int. J. Agric. Sustain., 10, 93-108.
- Ameur F., Kuper M., Lejars C., Dugué P., 2017. Prosper, survive or exit: contrasted fortunes of farmers in the groundwater economy in the Saiss plain. Agric. Water Manag., 191, 207-217.
- Armstrong D.P., 2004. Water-use efficiency and profitability on an irrigated dairy farm in Northern Victoria: a case study. Aus. J. Exp. Agr., 44, 137-144.
- Aubron C., Dorin B., Vigne M., Philippon O., 2017. Ressources en eau et élevage laitier en Inde : les révolutions verte et blanche intimement liées ? Rencontres internationales “Le lait, vecteur de développement”, Rabat, Maroc.
- Aubron C., Vigne M., Philippon O., Lucas C., Lesens P., Upton S., Salgado P., Ruiz L., 2019. Inputs intensive irrigated agriculture and crop-livestock disintegration. Problematic nitrogen balances in a Gujarati village, International seminar "Milk and Dairy in India’s Development Path. Lessons, challenges and perspectives", India International Centre, New Delhi, 17-18 December.
- Bilal M.Q., Suleman M., Raziq A., 2006. Buffalo: Black gold of Pakistan. Livest. Res. Rural Dev., 18, Article #128. http://www.lrrd.org/lrrd18/9/bila18128.htm
- Bingi S., Tondel F., 2015. Recent developments in the dairy sector in Eastern Africa. Briefing note of the European Centre for Development Policy Management, 78, 19 p.
- Borghese A., 2004. Recent developments of buffaloes in Europe and Near East. 7th World Buffalo Congress, Manila, Philippines, 10-16.
- Boyazoglu J., Morand-Fehr P., 2001. Mediterranean dairy sheep and goat products and their quality: a critical review. Small Rum. Res., 40, 1-11.
- Caumartin N., 2017. Évaluation des consommations d’énergie fossile et des émissions de gaz à effet de serre de systèmes laitiers contrastés en Inde. Mémoire de fin d’études de l’ISTOM (direction M. Vigne).
- Chatellier V., 2016. Le commerce international, européen et français des produits laitiers : évolutions tendancielles et dynamiques concurrentielles. INRA Prod. Anim., 29, 143-162.
- Chatellier V., Pouch T., Le Roy C., Mathieu Q., 2018. Les relations commerciales agroalimentaires de la Russie avec l’UE, l’embargo russe et les productions animales. INRA Prod. Anim., 3, 83-103.
- Chaumet J.M., 2018. Le secteur laitier chinois : entre pression des importations et reprise en main interne. Écon. Rurale, 324, 91-108.
- Clement F., Haileslassie A., Ishaq S., Samad M., Mit R., Shindey D.N., Dey A., Khan M.A., Blümmel M., Acharya N.S., 2010. Improving water productivity, reducing poverty and enhancing equity in mixed crop-livestock systems in the Indo-Gangetic Basin. CPWF Project Report, 103p.
- Commission Européenne, 2017. EU agricultural markets and income 2017-2030. Report, 90p. https://ec.europa.eu/agriculture/sites/agriculture/files/markets-and-prices/medium-term-outlook/2017/2017-fullrep_en.pdf
- Corniaux V., 2015. L’industrie laitière en Afrique de l’Ouest : histoire, stratégies et perspectives. Rapport du projet « MilkyWay for Development », 39p. http://agritrop.cirad.fr/575311/1/document_575311.pdf
- Corniaux C., Duteurtre G., Broutin C., 2014. Filières laitières et développement de l’élevage en Afrique de l’Ouest. L’essor des minilaiteries, Éditions Karthala, Paris, France, 242p.
- Corson M.S., Doreau M., 2013. Évaluation de l’utilisation de l’eau en élevage. INRA Prod. Anim., 26, 239-248.
- Cournut S., Chauvat S., Correa P., Dos Santos Filho J.C., Dieguez F., Hostiou N., Khahn Pham D., Servière G., Sraïri M.T., Turlot A., Dedieu B., 2018. Analyzing work organization by the Work Assessment Method: a meta-analysis. Agron. Sustain. Dev., 38, 58. https://doi.org/10.1007/s13593-018-0534-2
- Dahan C., Mingasson E., 2016. Voix lactées, sur la route du lait. Imprimeries Escourbiac, 208p.
- de Oliveira C.C., Xavier A.A.P., Ulbricht L., Moro A.R.P., Belinelli M.M., 2018. Health in rural environment: a postural evaluation of milking workers in Brazil. Cahiers Agricultures, 28, https://doi.org/10.1051/cagri/2018021
- Dong S.K., Long R.J., Gera den D., 1999. Yak farming on the Qinghai-Tibetan Plateau of China. NCTR Livestock Newsletter, 1-2, 10-14.
- Doreau M., 1991. Le lait de jument. INRA Prod. Anim., 4, 297-302.
- Dugdill B., Tsetsgee S.O., 2006. Mongolia: milk production, processing, consumption and outlook to 2010. Working paper for the 27th IDF World Dairy Summit”, FAO, Ulaan-Bator (Mongolia), 20-23 October, 11p.
- Falkenmark M., 2007. Shift in thinking to address the 21st century hunger gap. Moving focus from blue to green water management. Water Ressour. Manag., 21, 3-18.
- FAO, 2013. Milk and dairy product in human nutrition. Report, 375p. http://www.fao.org/ docrep/018/i3396e/i3396e.pdf
- FAO, 2016. Developing gender-sensitive value chains. A guiding framework. Report, 52p. http://www.fao.org/3/a-i6462e.pdf
- FAO, 2017a. The future of food and agriculture: trends and challenges. Report, 163p. http://www.fao.org/3/a-i6583e.pdf
- FAO, 2017b. Gender assessment of dairy value chains: evidence from Ethiopia, by Herego E., Rome, Italy, 66p. http://www.fao.org/3/a-i6695e.pdf
- FAO, 2018a. Dairy Market Review. Rome, 8p. http://www.fao.org/3/I9210EN/i9210en.pdf
- FAO, 2018b. Developing gender-sensitive value chains: guidelines for practitioners. Rome, Italy, 114p.http://www.fao.org/3/i9212en/I9212EN.pdf
- FAO, African Union, 2018. Leaving no one behind. Empowering Africa’s Rural Women for Zero Hunger and Shared Prosperity, 28p.http://www.fao.org/3/CA1506EN/ca1506en.pdf
- Faye B., 2016a. Food security and the role of local communities in the non-cow milk production. In: “Non-bovine milk and milk products” (Eds: E. Tsakalidou, K. Papadimitriou), Elsevier and AP publ., London, 1-13.
- Faye B., 2016b. Repères Economie. L’enjeu agricole saoudien : un défi environnemental. Moyen-Orient, 29, 62-65.
- Faye B., Konuspayeva G., 2012. The sustainability challenge of the dairy sector:the growing importance of the non-cattle milk production worldwide. Int. Dairy J., 24, 50-56.
- Faye B., Senoussi H., Jaouad M., 2017. Le dromadaire et l’oasis : du caravansérail à l’élevage périurbain. Cah. Agricult., 26, 8p.
- Foote K.J., Joy M.K., Death R., 2015. New Zealand dairy farming: milking our environment for all its worth. Int. Manag., 56, 709-720.
- Gaucheron F., 2011. Diversité des laits et des produits laitiers dans le monde. Les cahiers de l’OCHA, 15, 174-185.
- Gouin D.M., Kroll J.C., 2018. La régulation laitière face à la volatilité des marchés : États-Unis, Nouvelle-Zélande, Canada et Suisse. Écon. Rurale, 324, 13-30.
- Hemme T., Otte J., 2010. Status and prospects for smallholder milk production. A global perspective. FAO, Report, 186 p. http://www.fao.org/docrep/012/i1522e/i1522e.pdf
- Hoekstra A.Y., 2012. The hidden water resource use behind meat and dairy. Animal Front., 2, 3-8. https://doi.org/10.2527/af.2012-0038
- Holand Ø., Aikio P., Gjøstein H., Nieminen M., Hove K., White R., 2002. Modern reindeer dairy farming - the influence of different milking regimes on udder health, milk yield and composition. Small Rum. Res., 44, 65-73.
- Hostiou N., Cialdella N., Le Gal P.Y., 2015. Work organization on smallholder dairy farms: a process unique to each farm. Trop. Anim. Health Prod., 47, 1271-1278.
- Institut de l’Élevage, 2018a. Marchés mondiaux des produits laitiers : bien orientés grâce à la croissance mondiale. Dossier Écon. de l’Élevage, 490, 39p.
- Institut de l’Élevage, 2018b. La filière laitière chinoise, 10 ans après le scandale de la mélamine. Dossier Écon. de l’Élevage, 492, 53p.
- International Dairy Federation, 2018. Bulletin of the International Dairy Federation, 494, 199 p.
- Kathothya G., 2017. Gender assessment of dairy value chains: evidence from Kenya. FAO report, 80p. http://www.fao.org/3/a-i6786e.pdf
- Konuspayeva G., Camier B., Aleilawi N., Al-Shumeimyri M., Al-Hammad K., Algruin K., Alshammari F., Beaucher E., Faye B., 2017. Manufacture of dry and brine salted soft camel cheeses for the camel dairy industry. Int. J. Dairy Technol., 70, 92-101.
- Konuspayeva G., Faye B., 2011. Identité, vertus thérapeutiques et allégation santé : les produits fermentés d’Asie Centrale. Les cahiers de l’OCHA, 15, 135-145.
- Landes M., Cessna J., Kuberka L., Keithly J., 2017. India’s dairy sector: structure, performance and prospects. USDA-Report ERS, 272, 47p. https://www.ers.usda.gov/webdocs/publications/82639/ldpm-272-01.pdf?v=0
- Makhlouf M., Montaigne E., Tessa A., 2015. La politique laitière algérienne : entre sécurité alimentaire et soutien différentiel de la consommation. New Médit, 1, 12-23.
- Malacarne M., Martuzzi F., Summer A., Mariani P., 2002. Protein and fat composition of mare’s milk: some nutritional remarks with reference to human and cow’s milk. Int. Dairy J., 12, 869-877.
- Morin D.E., Rowan L.L., Hurley W.L, Braselton W.E., 1995. Composition of milk from Llama in the United States, J. Dairy Sci., 78, 1713-1720.
- Mueller B., Acero F., Estruch, E., 2017. Creating employment potential in small-ruminant value chains in the Ethiopian Highlands. FAO Animal Production and Health Working Paper No. 16, FAO, Rome, Italy.
- Nagy P., Juma Bin Subaih S., Al BadriM., Juhasz J., 2014. The “bumpy” road of camel milk approval from the United Arab Emirates to the European Union: the “Camelicious” experience. 1st Int. Meeting « Le lait, vecteur de développement », 21-23 mai, Rennes, France, p174.
- Njuki J., Kaariab S., Chiuri W., 2011. Linking Smallholder Farmers to Markets, Gender and Intra-Household Dynamics: Does the Choice of Commodity Matter? Eur. J. Dev. Res., 23, 426-443. https://dx.doi.org/10.1057/ejdr.2011.8
- Novo A.M., Jansen K., Slingerland M., 2012. The sugarcane-biofuel expansion and dairy farmers’ responses in Brazil. J. Rural Stud., 28, 640-649.
- OCDE-FAO, 2018. Perspectives agricoles 2018-2027. Éditions OCDE, Paris, 123p. http://www.fao.org/3/i9166fr/I9166FR.pdf
- ONU, 2017. World population prospects: the 2017 revision. New York, 53p. https://population.un.org/wpp/Publications/Files/WPP2017_KeyFindings.pdf
- Pei X., Tandon A., Alldrick A., Giorgi L., Huang W., Yand R., 2011. The China melamine milk scandal and its implications for food safety regulation. Food Policy, 36, 412-420.
- Perrot C., Chatellier V., Gouin D.M., Richard M., You G., 2018. Le secteur laitier français est-il compétitif face à la concurrence européenne et mondiale ? Écon. Rurale, 364, 109-127.
- Pflimlin A., 2010. Europe laitière : valoriser tous les territoires pour construire l’avenir. Éditions La France Agricole, 314p.
- Rico M.N., 2017. Medición del trabajo no remunerado en el contexto de los ODS y la Agenda Regional de Género. In: Desafíos para la implementación de la Agenda 2030 “dimensión económica”. Seminario Objetivos del Desarrollo Sostenible, CEPAL, Paraguay.
- Rutagwenda T., Lechner-Doll M., Schwartz H.J., Schultka W., von Engelhardt W., 1990. Dietary preference and degradability of forages on a semi-arid thornbush savannah by indigenous ruminants, camels and donkeys. Anim. Feed Sci. Tech., 31, 179-192.
- Santos Filho, J.C., Hostiou, N., Damasceno J.C., Dedieu B., 2012. Room for manoeuvre in time of the workforce in dairy production systems. Revista Brasileira de Zootecnia, 41, 2450-2457.
- Seck M., Marshall K., Fadiga M.L., 2016. Cadre politique pour le développement de la filière laitière au Sénégal. ILRI project report, 65p. https://cgspace.cgiar.org/bitstream/handle/10568/80672/senegal_dairy_pr_fr.pdf
- Shah T., 2009. India’s groundwater irrigation economy: the challenge of balancing livelihoods and environment. Quarterly J. Central Ground Water Board (CGWB), 24, 21-37.
- Singh O.P., Sharma A., Singh R., Shah T., 2004. Virtual water trade in dairy economy: irrigation water productivity in Gujarat. Écon. Polit. Wkly., 39, 3492-3497.
- Sraïri M.T., 2011. Le développement de l’élevage au Maroc : succès relatif et dépendance alimentaire. Le Courrier de l’Environnement de l’INRA, 60, 91-101.
- Sraïri M.T., Bahri S., Kuper M., 2013. Le travail et sa contribution aux stratégies d’adaptation de petites exploitations agricoles familiales mixtes d’élevage bovin/polyculture au Maroc. Biotechnol. Agron. Soc. Environ., 17, 463-474.
- Sraïri M.T., Ghabiyel Y., 2017. Coping with the work constraints in crop-livestock farming systems. Ann. Agric. Sci., 62, 23-32.
- Tilman D., Cassman K.J., Matson P.A., Naylor R., Polasky S., 2002. Agricultural sustainability and intensive production practices. Nature, 418, 671-677.
- Udo H.M.J., Aklilu H.A., Phong L.T., Bosma R.H., Budisatria I.G.S., Patil B.R., Samdup T., Bebe B.O., 2011. Impact of intensification of different types of livestock production in smallholder crop-livestock systems. Livest. Sci., 139, 22-29.
- USDA, 2017. Agricultural projections to 2026. Report, 106p. https://www.usda.gov/oce/commodity/projections/USDA_Agricultural_Projections_to_2026.pdf
- Wernery U., 2006. Camel milk, the white gold of the desert. J. Camel Pract. Res., 13, 15-26.
- Wiggins S., Kirsten J., Llambí L., 2010. The Future of Small Farms. World Dev. 38, 1341-1348.
- Willett W., Rockström J., Loken B., Springmann M., Lang T., Vermeulen S., Ganett T., Tilman D., DeClerck F., Wood., Jonell M., Clark M., Gordon L.J., Fanzo J., Hawkes C., Zurayk R., Rivera J.A., De Vries W., Sibanda L.M., Afshin A., Chaudhary A., Herrero M., Agustina R., Branca F. Lartey A., Fan S., Crona B., Fox E., Bignet V., Troell M., Lindahl T., Singh S., E Cornell S., Srinath Reddy K., Narain S., Nishtar S., Murray Christopher J.L., 2019. Food in the Anthropocene: the EAT-Lancet commission on healthy diets from sustainable food systems. The Lancet. https://doi.org/10.1016/S0140-6736(18)31788-4
- World Bank, 2006. Gender, Time Use, and Poverty in Sub-Saharan Africa. World Bank working paper n°73.
- Yilma Z., Guernebleich E., Sebsibe A., 2011. A review of the Ethiopian dairy sector. FAO report, 83 p. http://www.fao.org/3/a-aq291e.pdf
- Zia U., Mahmood T., Ali M.R., 2011. Dairy development in Pakistan. FAO report, 54p. http://www.fao.org/docrep/014/al750e/al750e00.pdf
Abstract
The dairy sector occupies an important place worldwide, in terms of contribution to agricultural land use, jobs and wealth creation. Dairy production results from varied production models from one country to another and is based on animal species with different characteristics. It has increased dramatically in recent decades. The future development of milk production is subject to various constraints that question the best ways of achieving sustainability. In this context, the first part of this article presents the dynamics of the dairy sector in terms of consumption and production in various major geographical areas. The second part deals with the sustainability of the dairy sector, mainly in developing countries, through a selection of three themes: i- the social dimension (often forgotten) and the need to mainstream gender issues; ii- the sustainable use of water resources in Morocco and India, chosen to illustrate two contrasting situations; iii- biodiversity and the essential contribution of non-bovine milks to local development. The third part recalls that international trade exchanges make it possible for many countries with a deficit in milk to meet domestic demand.
Attachments
No supporting information for this articleArticle statistics
 Views: 25319
Downloads
 PDF: 806
Most read articles by the same author(s)
- Vincent CHATELLIER, Dependance of West Africa on dairy product importations , INRAE Productions Animales: Vol. 33 No. 2 (2020)
- Philippe FAVERDIN, Clément ALLAIN, Raphaël GUATTEO, Nathalie HOSTIOU, Isabelle VEISSIER, Precision Livestock Farming: New information to help decision-making? , INRAE Productions Animales: Vol. 33 No. 4 (2020)
- Vincent CHATELLIER, Pierre DUPRAZ , The economic performance of European livestock farming: From the "cost competitiveness" to the "non-cost competitiveness" , INRAE Productions Animales: Vol. 32 No. 2 (2019): Volume 32 Issue 2: Special Issue. Major challenges and solutions for livestock farming
- Vincent CHATELLIER, World, European and French trade in poultry meat , INRAE Productions Animales: Vol. 38 No. 1 (2025)
- Isabelle VEISSIER, Florence KLING-EVEILLARD, Marie-Madeleine MIALON, Mathieu SILBERBERG, Alice DE BOYER DES ROCHES, Claudia TERLOUW, Dorothée LEDOUX, Bruno MEUNIER, Nathalie HOSTIOU, Precision Livestock Farming and animal welfare: is the numerical revolution of agriculture able to take into account animals’ and farmers’ needs? , INRAE Productions Animales: Vol. 32 No. 2 (2019): Volume 32 Issue 2: Special Issue. Major challenges and solutions for livestock farming
- Gérard SERVIÈRE, Sophie CHAUVAT, Nathalie HOSTIOU, Sylvie COURNUT, Work in Livestock and its changes , INRAE Productions Animales: Vol. 32 No. 1 (2019)
- Caroline DEPOUDENT, Nathalie HOSTIOU, Lisa LE CLERC, Working in pig farming: attractiveness factors and constraints , INRAE Productions Animales: Vol. 34 No. 2 (2021)
- Vincent CHATELLIER, Farm income for farmers and livestock breeders in France: high inter-annual variability (2010-2022) and major disparities , INRAE Productions Animales: Vol. 37 No. 3 (2024)
- Vincent CHATELLIER, Organic farming and organic animal products in France: after the boom, the shock of inflation , INRAE Productions Animales: Vol. 37 No. 2 (2024): Special issue: Organic livestock farming: conditions and potential for development
- Vincent CHATELLIER, Internationalization of markets in animal production , INRAE Productions Animales: Vol. 32 No. 2 (2019): Volume 32 Issue 2: Special Issue. Major challenges and solutions for livestock farming